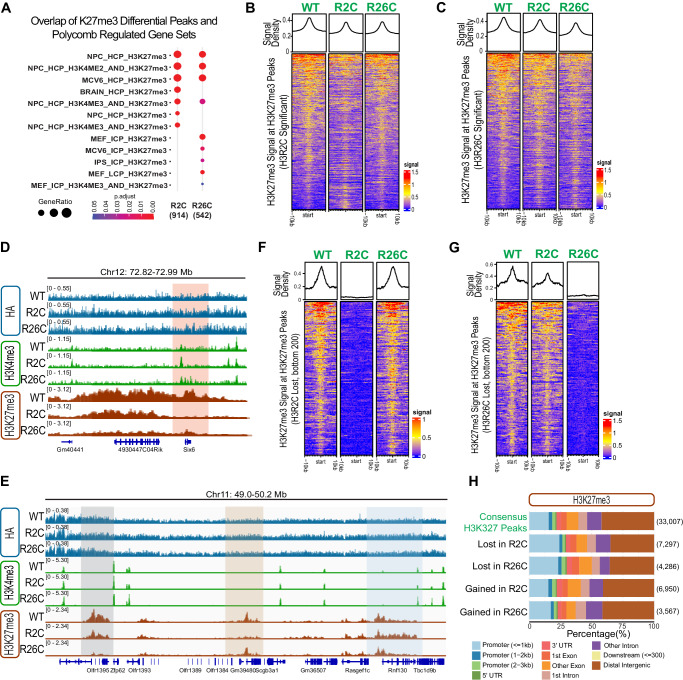
Fig. 3. H3R2 and H3R26 mutants alter H3K27me3 in a locus-specific manner.
A Enrichment of differential H3K27me3 peaks in known polycomb-regulated datasets. B H3K27me3 signal at H3K27me3 differential peaks in H3R2C or C H3R26C. D IGV (version 2.15.4) tracks of representative regions, with differential H3K27me3 peaks (mutant/WT) lost in both H3R2C and HR26C (red shading), E lost in H3R2C alone (beige shading), H3R26C alone (gray shading) or gained in H3R2C (blue shading). Histograms are overlayed for 3 independent replicates for each genotype (see Supplementary Fig. S3A, B for separated individual replicates). F H3K27me3 differential peaks (H3R2C versus H3WT) with the greatest magnitude loss in H3R2C (bottom 200 peaks). G H3K27me3 differential peaks (H3R26C versus H3WT) with the greatest magnitude loss in H3R26C (bottom 200 peaks). H Types of genomic regions associated with lost H3K27me3 peaks in H3R2C and H3R26C compared to consensus peaks. The number of peaks in each group is indicated in parentheses.

