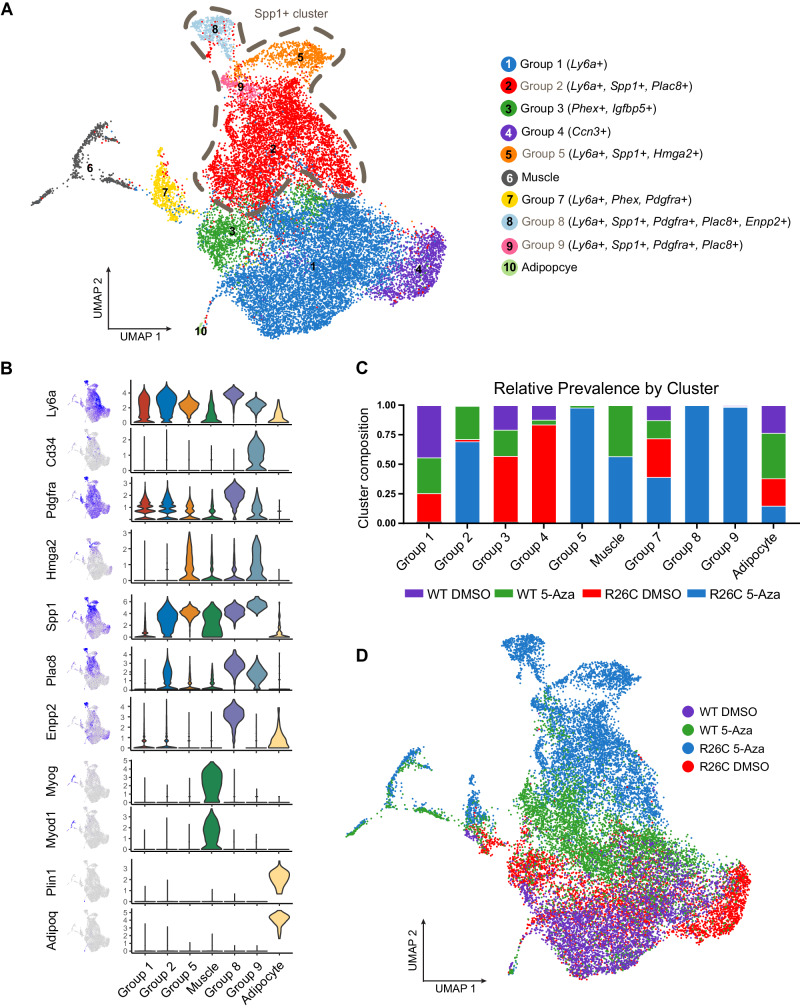
Fig. 6. H3R26C mutant expressing MPC form populations after differentiation induction that are distinct from H3WT.
H3WT and H3R26C expressing MPC were induced to differentiate with 5-Azacitidine (5-Aza) and transcriptionally profiled as single cells along with vehicle (DMSO) controls. A The transcriptomes of all four conditions are represented as ten clusters on a UMAP projection with relevant marker genes or linage assignments listed with the group names. The dashed line indicates Spp1+ groups, which are labeled with grey font. B The expression of individual marker genes was plotted for groups of interest and overlayed on the UMAP. C The proportion of sample (by genotype and treatment) represented in each group (source data are provided as a Source Data file) are plotted. D The sample identities are projected on the same UMAP as panel A.

