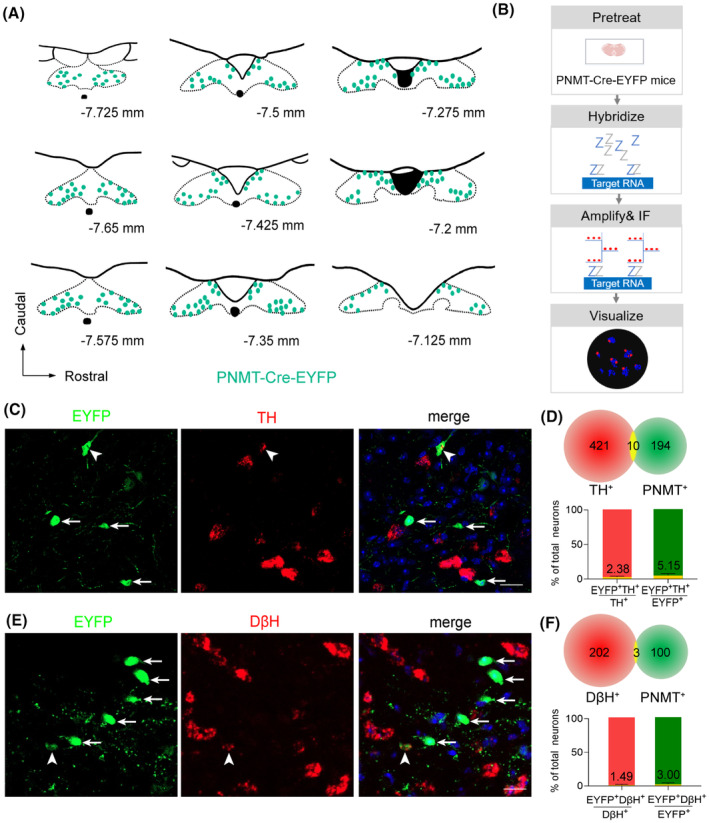
FIGURE 1.

Distribution and chemical phenotypes of NTSPNMT neurons. (A) Schematic of rostrocaudal distribution of PNMT‐expression neurons (EYFP+) in the NTS from a PNMT‐Cre‐EYFP transgenic mouse. PNMT‐expression neurons were pinpointed in each coronal plane based on immunohistochemical detection. (B) Schematic of a experimental preceduare for fluorescent in situ hybridization. (C) Photomicrographs showing the co‐expression of TH RNA (red) and PNMT (green) in the NTS. Blue, DAPI. The neuron indicated by the white arrowhead is the PNMT neuron with co‐expression of TH, while the neurons indicated by the white arrow are PNMT neurons without the co‐expression of TH. Scale bar, 20 μm. (D) Quantification of the co‐expression of TH RNA and PNMT (n = 3 samples, from 3 mice). (E) Photomicrographs showing the co‐expression of DβH RNA (red) and PNMT (green) in the NTS. Blue, DAPI. The neuron indicated by the white arrowhead is the PNMT neuron with the co‐expression of DβH, while the neurons indicated by the white arrows are PNMT neurons without the co‐expression of DβH. Scale bar, 20 μm. (F) Quantification of the co‐expression of DβH RNA and PNMT (n = 3 samples, from 3 mice).
