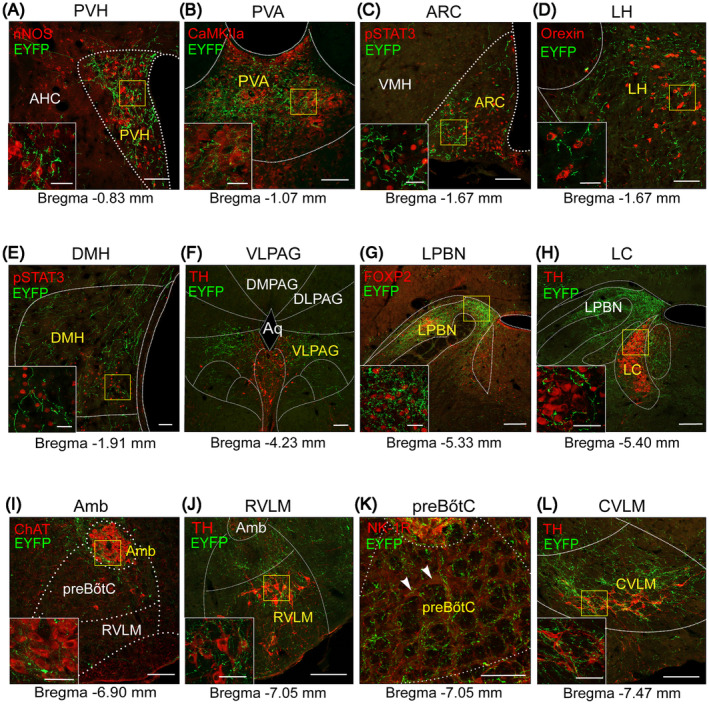
FIGURE 8.

Typical images showing selected nuclei receiving outputs from NTSPNMT neurons. Confocal images showing regional distribution of axonal terminals (green) originating from NTSPNMT neurons. Each brain region was marked by nNOS (red) in the PVH (A), CaMKIIa (red) in the PVA (B), pSTAT3 (red) in the ARC (C) and DMH (E), Orexin (red) in the LH (D), TH (red) in the PAG (F), LC (H), RVLM (J), and CVLM (L), ChAT (red) in the Amb (I), FOXP2 (red) in LPBN (G), and NK‐1R (red) in preBötC (K). Scale bars, 100 μm. The white solid boxes show the magnified fluorescence image of yellow solid boxes of each image. Scale bars, 50 μm. AHC, anterior hypothalamic area, central part; Amb, ambiguus nucleus; Aq, aqueduct (Sylvius); ARC, arcuate nucleus; CVLM, caudal ventrolateral medulla; DLPAG, dorsolateral periaqueductal gray; DMH, dorsomedial hypothalamus; DMPAG, dorsomedial periaqueductal gray; LC, locus coeruleus; LH, lateral hypothalamic area; LPBN, lateral parabrachial nucleus; PAG, periaqueductal gray; preBötC, pre‐Bötzinger complex; PVA, paraventricular thalamic nucleus, anterior part; PVH, paraventricular hypothalamus; RVLM, rostral ventrolateral medulla; VLPAG, ventrolateral periaqueductal gray; VMH, ventromedial hypothalamic nucleus.
