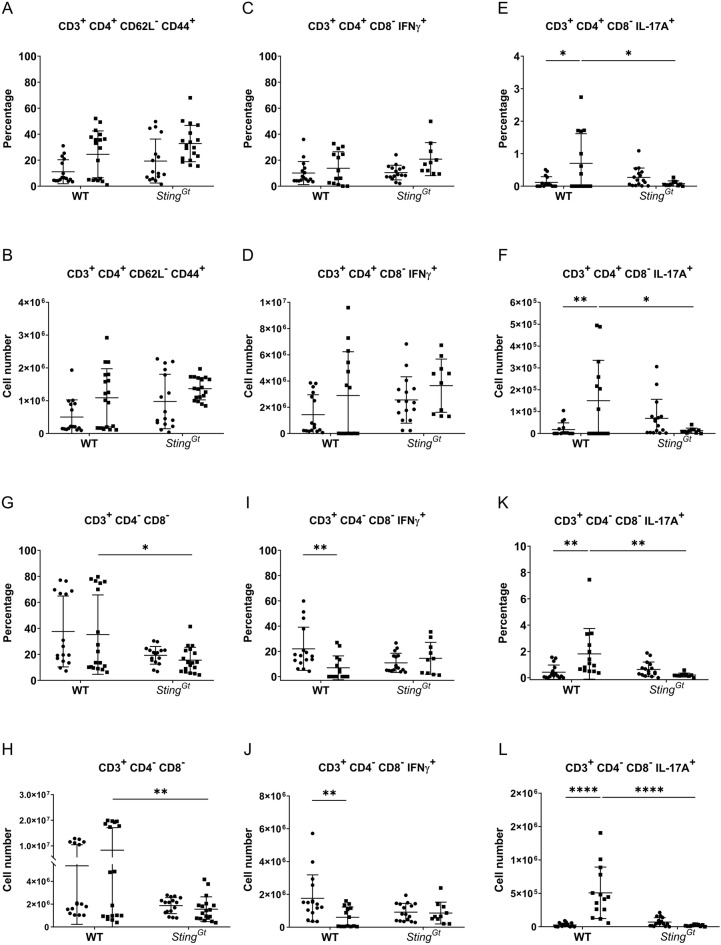
Figure 3.
STING involved in double-negative T cell expansion and IL-17A production. The isolated splenocytes from WT and StingGt mice were stained and analyzed by flow cytometry. Data show the proportion and the absolute number of cells (A,B) effector memory T cells (CD3+CD4+CD62L-CD44+) out of CD4+ T cells, (C,D) IFN-γ producing T helper cells (CD3+ CD4+CD8-IFNγ+) out of CD4+ T cells, (E,F) IL-17A producing T helper cells (CD3+CD4+CD8-IL-17A+) out of CD4+ T cells, (G,H) double-negative T cells (CD3+CD4-CD8-) out of CD3+ T cells, and (I,J) IFN-γ producing double-negative T cells (CD3+CD4-CD8-IFNγ+) out of double-negative T cells, and (K,L) IL-17A producing double-negative T cells (CD3+CD4-CD8-IL-17A+) out of double-negative T cells. Cell numbers are shown per spleen. Data are shown as mean ± SD; p-values were indicated *p < 0.05, **p < 0.01, ***p < 0.001, and ****p < 0.0001. Dot ● indicates control, and square ■ indicates PIL (N = 10–18 mice/group).

