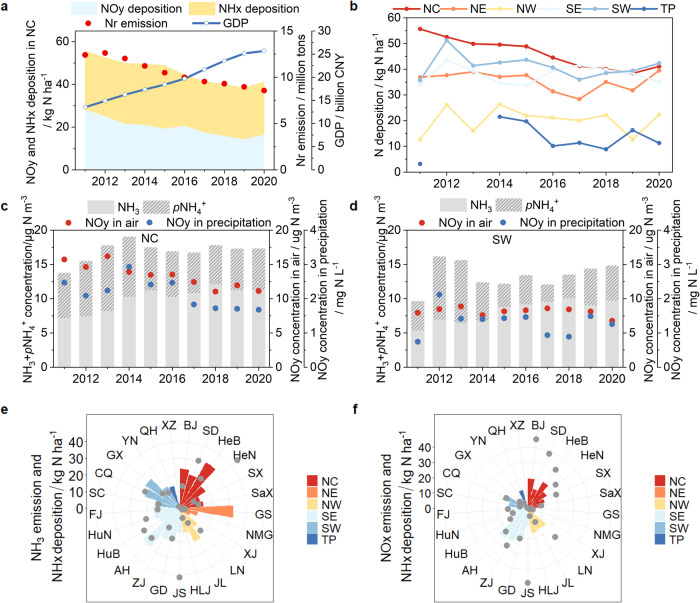
Fig. 4. Characteristics of interannual variability of N deposition in different regions.
a N deposition, Nr emission, and Gross Domestic Product (GDP) in North China (NC); b interannual variation of N deposition in NC, Northeast China (NE), Northwest China (NW), Southeast China (SE), Southwest China (SW), and the Tibetan Plateau (TP); c, d NH3 and pNH4+ concentrations in the air, oxidized N concentrations in the air and precipitation over NC and SW; e, f differences in N deposition and Nr emissions at the provincial scale (BJ Beijing, SD Shandong, HeB Hebei, HeN Henan, SX Shanxi, SaX Shaanxi, GS Gansu, NMG Inner Mongolia, XJ Xinjiang, LN Liaoning, JL Jilin, HLJ Heilongjiang, JS Jiangsu, GD Guangdong, ZJ Zhejiang, AH Anhui, HuB Hubei, HuN Hunan, FJ Fujian, SC Sichuan, CQ Chongqing, GX Guangxi, YN Yunnan, QH Qinghai, XZ Tibet). Source data are provided as a Source Data file.

