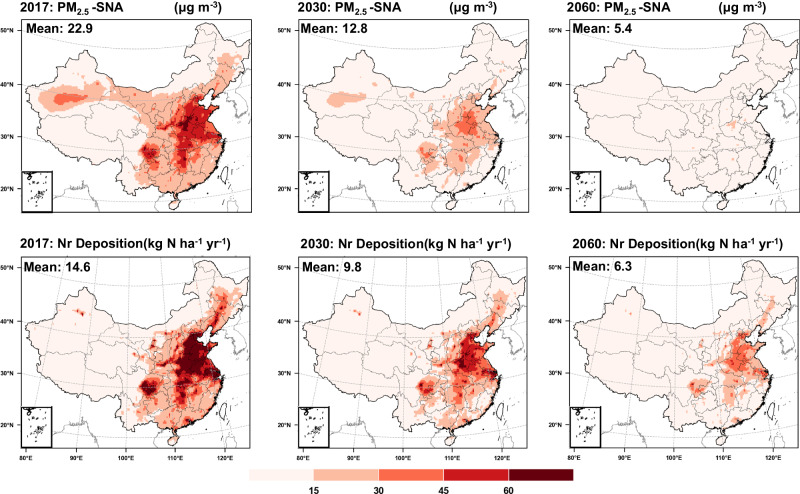
Fig. 5.
Annual average PM2.5-SNA concentrations and N deposition in China in 2017, 2030, and 2060, using the WRF-EMEP model under the most stringent policy implementations and rising temperatures and increased extreme precipitation (RCP4.5_2030, RCP4.5_2060) in 2030 and 2060. The map data are provided by the Resource and Environment Science and Data Center Institute of Geographic Sciences and Natural Resources Research, Chinese Academy of Sciences (10.12078/2023010103, 2023).

