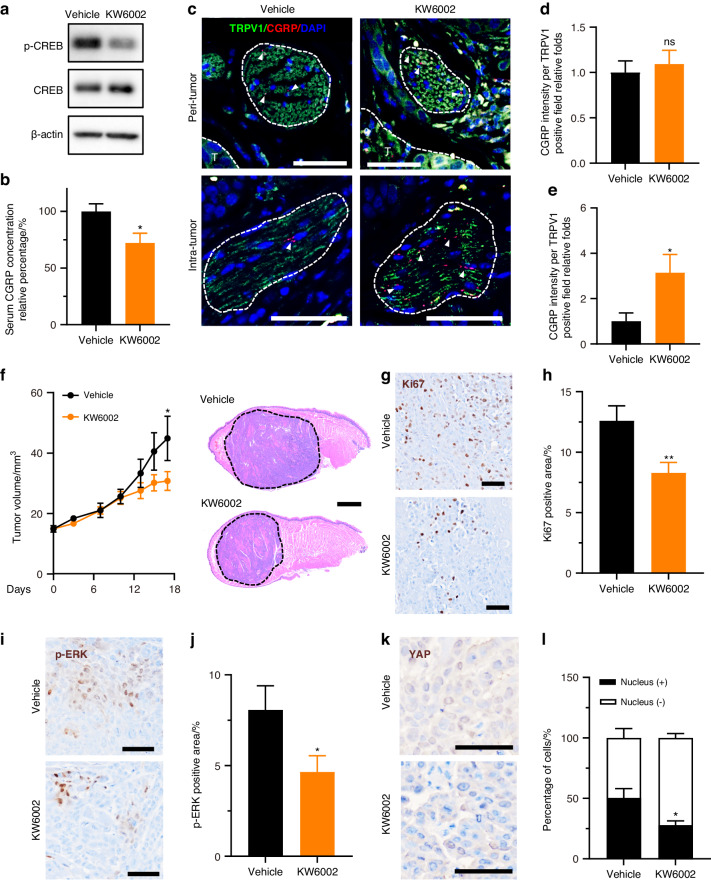
Fig. 5.
Istradefylline impeded OSCC growth by blocking trigeminal A2AR-induced CGRP release. a Phosphorylation of CREB and total CREB in trigeminal ganglia of mice carrying HSC3 tumor xenograft and tumor-bearing mice treated with 6 mg/kg KW6002 for 3 h. b Relative percentage of CGRP level in serum from tumor-carrying mice with or without 6 mg/kg KW6002 treatment. n = 6 mice. c Represented immunostaining of CGRP (red, arrowheads) in TRPV1+ neuronal niche (green, circled 1 000 µm2). The curves in the upper panels delineated the tumor area (T, blue). Scale bars, 50 μm. d Comparison of CGRP immunofluorescence intensity of each TRPV1-positive field (1 000 µm2) in the peri-tumor area represented, n = 9 random fields from 3 mice. e Comparison of CGRP immunofluorescence intensity of each TRPV1-positive field (1 000 µm2) in intra-tumor area. n = 9 random fields from 3 mice. f In vivo growth of HSC3 xenograft in nontreated mice and those treated with 6 mg/kg KW6002, n = 6 mice. (Left panel). Representative HE images of HSC3 xenografts in mice treated with vehicle or 6 mg/kg KW6002. Scale bar, 1 mm. (Right panel). g Immunostaining of Ki67 in tumor xenograft in nontreated or treated group. Scale bars, 50 μm. h Quantification of Ki67-positive area in tumor xenograft in the nontreated or treated group, n = 15 random fields from 5 mice. i Immunostaining of p-ERK in tumor xenograft of the nontreated or treated group. Scale bars, 50 μm. j Quantification of p-ERK-positive area in tumor xenograft of the nontreated or treated group, n = 15 random fields from 5 mice. k Immunostaining of YAP in tumor xenograft of nontreated or treated group. Scale bars, 50 μm. l Quantification of the percentage of YAP nuclear-positive cells of nontreated or treated group, n = 9 random fields from 3 mice. Statistical analysis was conducted using unpaired Student’s t-test (b, d, e, h, j, l) and two-way ANOVA with Bonferroni post hoc test (f)

