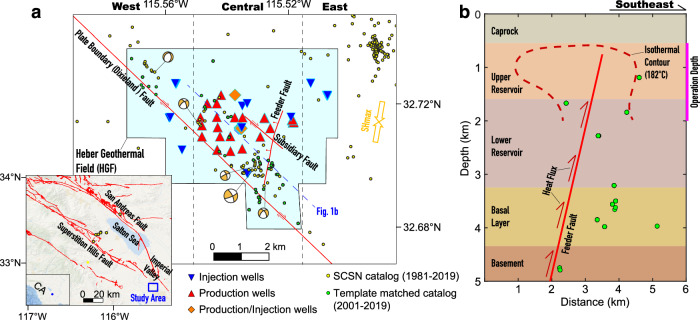
Fig. 1. Geologic settings of the Heber Geothermal Field.
a Spatial distribution of operation wells and faults. Yellow and green dots show the events detected by Southern California Seismic Network (SCSN, 10.7914/SN/CI) and with the method of template matching (see Methods for more details). Beachballs show the focal mechanisms of five M > 2 events in the SCSN catalog. The study area is divided into three regions (west, central, and east) to investigate temporal variations of surface displacement. The orientation of the maximum horizontal principal stress (SHmax) is from the SCEC Community Stress Model (https://www.scec.org/research/csm), which compiles multiple sources of information. b Simplified hydro-thermo-geological profile of the HGF. The feeder fault serves as an upwelling channel of heat flux, with the dashed line showing the 182 °C isothermal contour16. Circles show earthquake locations projected along the profile in Fig. 1a. The depths of open-hole sections for injection and production wells range from 0.5 to 2 km (pink vertical bar), except for six wells with open-hole depths exceeding 2 km but less than 3.2 km (Supplementary Table 1).

