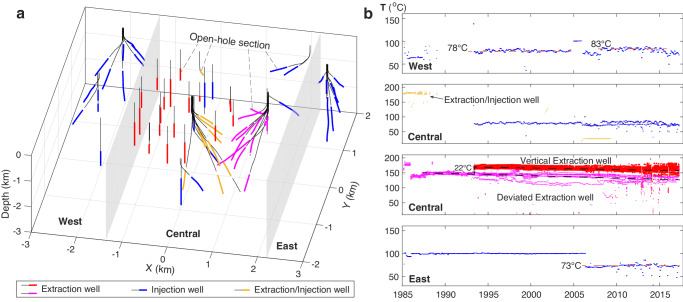
Fig. 2. Operation wells and temperature records of the Heber Geothermal Field.
a 3D view of realistic injection and extraction well trajectories. Open-hole sections for geothermal operation are marked with bold colored line. Two gray planes are used to distinguish the three regions (west, central, and east) of the study area. b Temporal variation of injection and production fluid temperatures in the west, central and east regions of the HGF. Each dot in the four panels represents the monthly temperature record of one well. The colors of the dots are consistent with those of the open-hole sections of corresponding wells seen in a.

