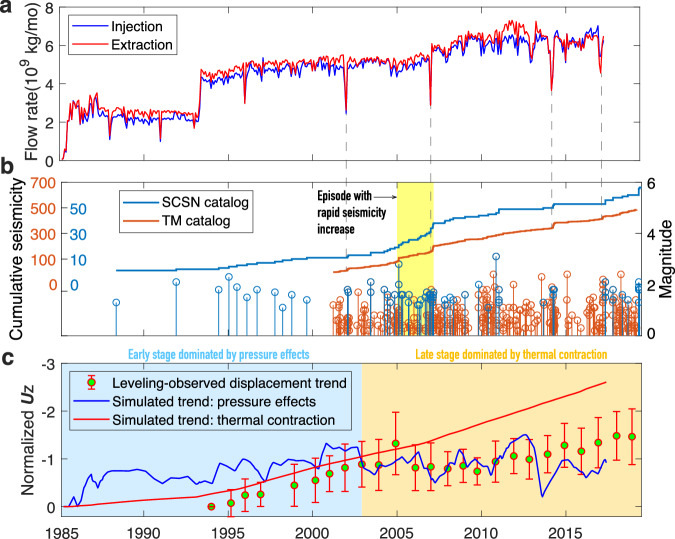
Fig. 4. Temporal distribution of operation volumes, seismicity and vertical displacement at the HGF.
a Monthly injection and extraction volumes for all HGF wells. Production rates of each well refer to Supplementary Fig. 5. b Temporal distribution of earthquake magnitudes and cumulative seismicity within the scope of the HGF based on the regional (SCSN) and template matching (TM) catalogs. The vertical dashed lines denote periods of rapid seismicity rate changes associated with rapid decreases in both the fluid injection and extraction volumes. c Vertical displacement (Uz) trends of the HGF. Red bars show the normalized displacement trend from leveling time series. Blue and red curves represent the simulated displacement trends caused by the pressure effects (pressure fluctuation and poroelastic responses) and thermal contraction effect, respectively. The simulated trends are obtained from the normalization of surface displacements at 8 probe points (see Fig. 7 for their locations). Note the vertical scale is inverted such that an increasing trend represents increasing subsidence.

