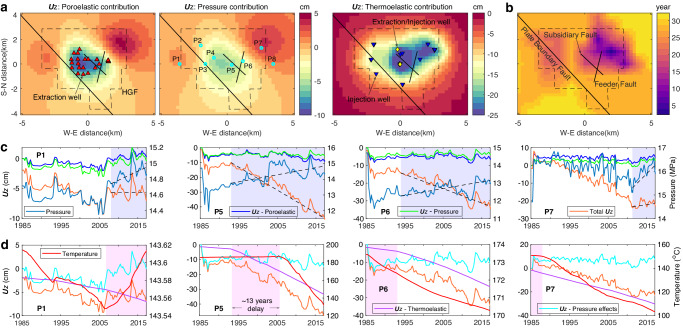
Fig. 8. Spatiotemporal evolution of thermo-poro-elastic effects.
a Vertical surface displacement (Uz) on 2016/06/17 due to pore pressure fluctuation, poroelastic responses, and thermal contraction. b Timing (relative to 1985/4/1) of the thermal contraction effect exceeding the joint effects of pressure fluctuation and poroelastic responses. c Temporal evolution of the effects of pressure fluctuation and poroelastic responses at four probe points. Shaded regions show the time periods with contrary trends (marked with black dashed lines) of cumulative vertical surface displacements (orange curves) and pressure changes (denim blue curves) at the four points with depths equal to 1.5 km. Blue and green curves show the Uz changes due to pressure fluctuation and poroelastic responses, respectively. d Temporal evolution of the thermal effect at four probe points. Shaded regions show the time periods with opposing trends of cumulative vertical displacement and temperature (red curves). Magenta and cyan curves show the Uz changes due to thermal contraction and the joint effects of pressure fluctuation and poroelastic responses, respectively. Temporal evolution of thermo-poro-elastic effects at the other four points (P2-P4 and P8) refers to Supplementary Fig. 24.

