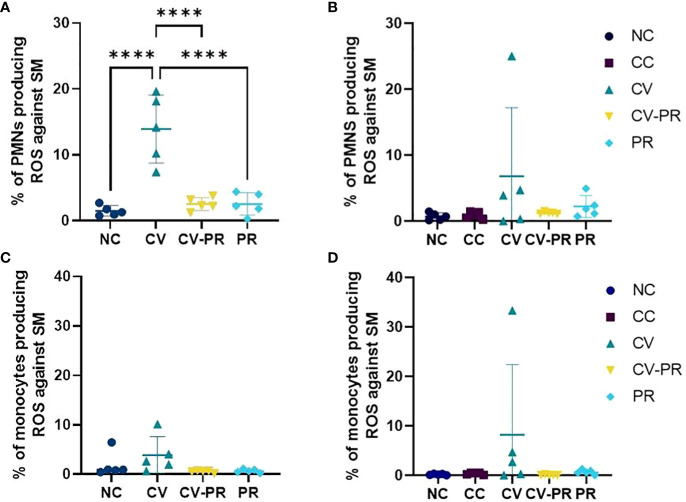
Figure 2.
Reactive oxygen species (ROS) production of phagocytes. Percentage of ROS-producing phagocytes stimulated with Map sonicate (SM) in experimental groups: non-challenged controls (NC), challenged controls (CC), commercial vaccine (CV), commercial vaccine and probiotic (CV-PR), and probiotic (PR). (A) Neutrophil (PMN) ROS activity at PT1 (1 month post-treatment initiation), (B) PMN ROS activity at PT4 (4 months post-treatment initiation and 3 months post-challenge with Map), and (C) monocyte ROS activity at PT1 (1 month post-treatment initiation), (D) monocyte ROS activity at PT4 (4 months post-treatment initiation and 3 months post-challenge with Map). ANOVA with Tukey’s post-hoc test was applied, and the significant level was ****p < 0.0001.

