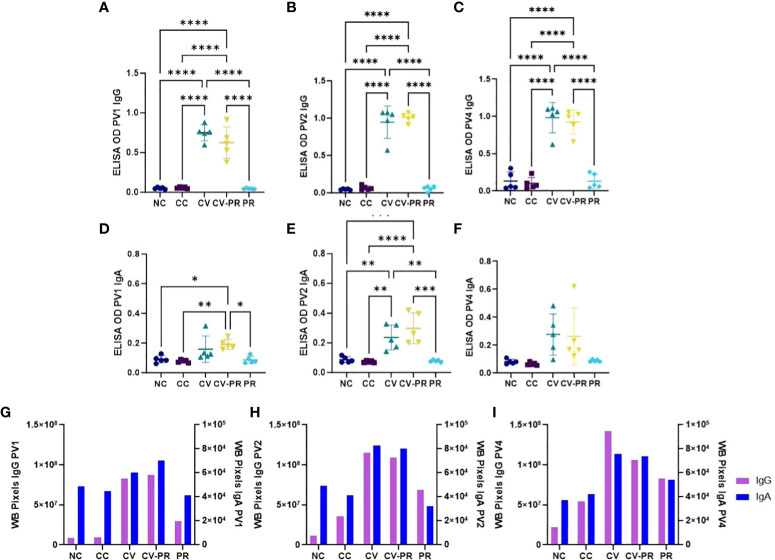
Figure 5.
Humoral response to Map antigens. Antibody reactivity detection in experimental groups: non-challenged controls (NC), challenged controls (CC), commercial vaccine (CV), commercial vaccine and probiotic (CV-PR), and probiotic (PR). ELISA OD showing the mean values of n = 5 for each timepoint and standard deviation of anti-IgG reactivity to PPA-3 at (A) PV1, (B) PV2, and (C) PV4 and anti-IgA reactivity to PPA-3 (D), PV1 (E), and PV2 (F) PV4. ANOVA with Tukey’s post-hoc test was applied, and the significant levels were *p < 0.05, **p < 0.001, ***p < 0.0005, and ****p < 0.0001. Reactivity of immunoblot strips calculated with Image J software showing one value per experimental group and isotype (IgG and IgA) at (G) PV1, (H) PV2, and (I) PV4.

