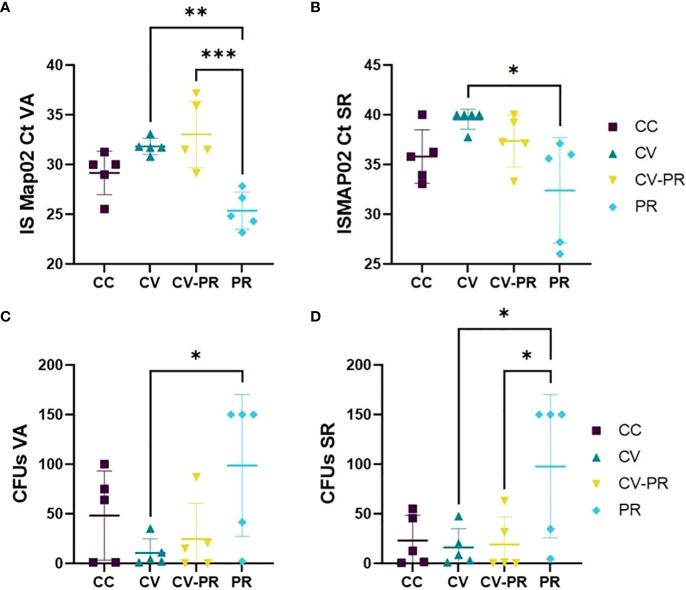
Figure 6.
Map burden in gut-associated lymphoid tissue. Map detection or isolation in the experimental groups: challenged controls (CC), commercial vaccine (CV), commercial vaccine and probiotic (CV-PR), and probiotic (PR) by (A) Cts for PCR ISMAP02 in vermiform appendix (VA), (B) Cts for PCR ISMAP02 in sacculus rotundus (SR), (C) culture results expressed in colony-forming units (CFUs) in VA, and (D) culture results expressed in CFUs in SR. ANOVA with Tukey’s post-hoc test was applied, and the significant levels were *p < 0.05, **p < 0.001, and **p < 0.0001.

