FIGURE 3.

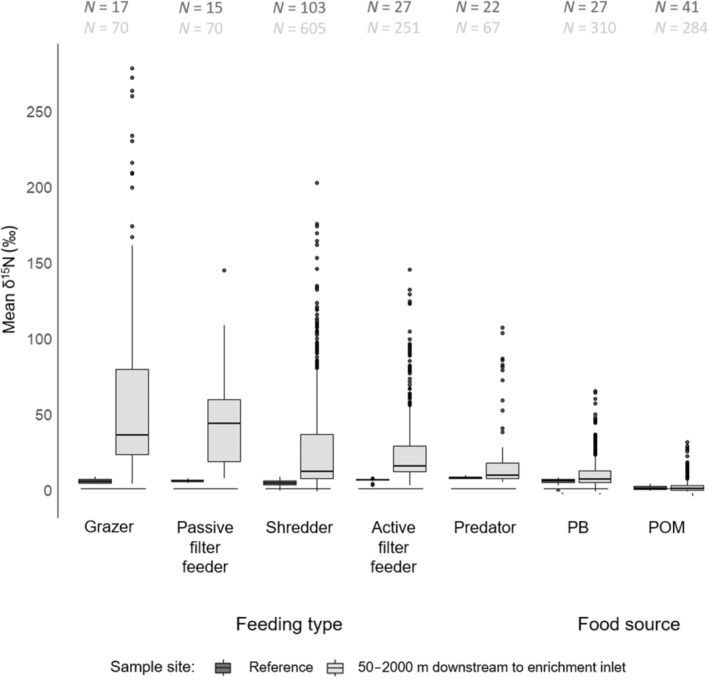
δ 15N measurements of macroinvertebrate specimens grouped by feeding types and of food sources at non‐enriched reference sites (light grey) and at enriched sites (dark grey). N, number of specimens analysed.

δ 15N measurements of macroinvertebrate specimens grouped by feeding types and of food sources at non‐enriched reference sites (light grey) and at enriched sites (dark grey). N, number of specimens analysed.