FIGURE 1.

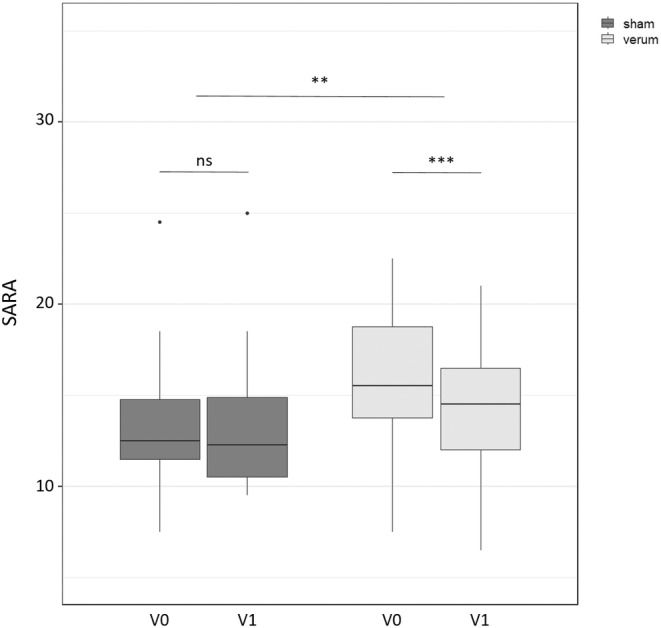
SARA scores from verum and sham group at baseline (V0) and after 5 days of rTMS (V1). Stars indicate the level of significance from Bonferroni adjusted p values (**p < 0.01, and ***p < 0.001).

SARA scores from verum and sham group at baseline (V0) and after 5 days of rTMS (V1). Stars indicate the level of significance from Bonferroni adjusted p values (**p < 0.01, and ***p < 0.001).