
FIGURE 2.
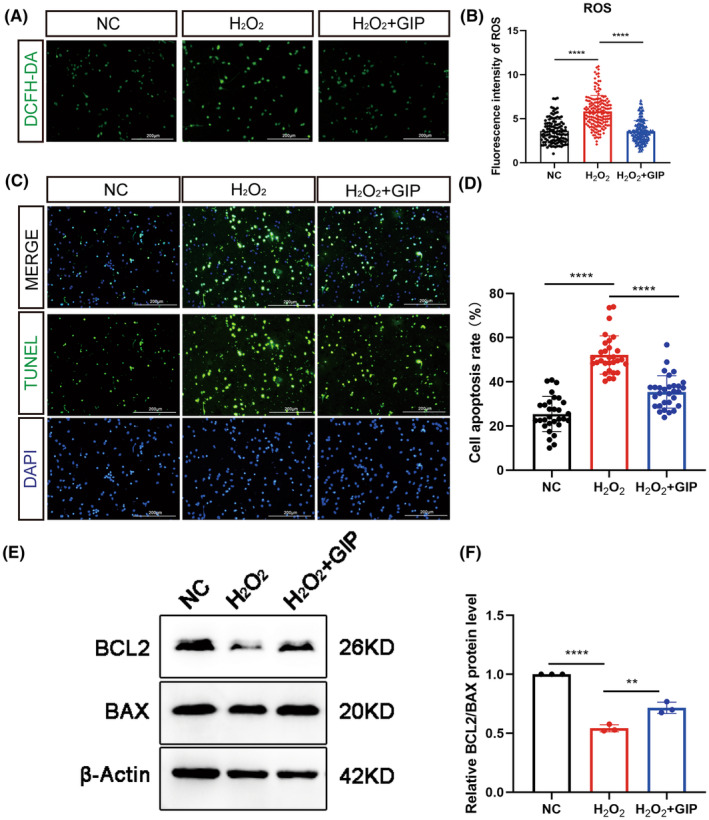
Effect of GIP on the ROS level in neurons under oxidative stress. (A, B) GIP decreased ROS level after H2O2 treatment. ROS signals were probed by DCFH‐DA. Scale Bar = 200 μm. n = 100–150 neurons for each group per test, N = 3 (cells were from rats interpedently). The data were shown as mean ± SE, and were analyzed by one‐way ANOVA, ****p < 0.0001. (C, D) GIP decreased the number of apoptotic cells. The cell apoptosis was determined by TUNEL assay. n = 30 for each group per test, N = 3. The data were shown as mean ± SE, and were analyzed by one‐way ANOVO, ***p < 0.001, ****p < 0.0001. Scale Bar = 200 μm. (E, F) GIP increased the ratio of BCL2/BAX protein after treatment of H2O2. The data were normalized by negative ctrl (NC) group. n = 3. The data were shown as mean ± SE, and were analyzed by one‐way ANOVA, **p < 0.01, ****p < 0.0001.