FIGURE 5.

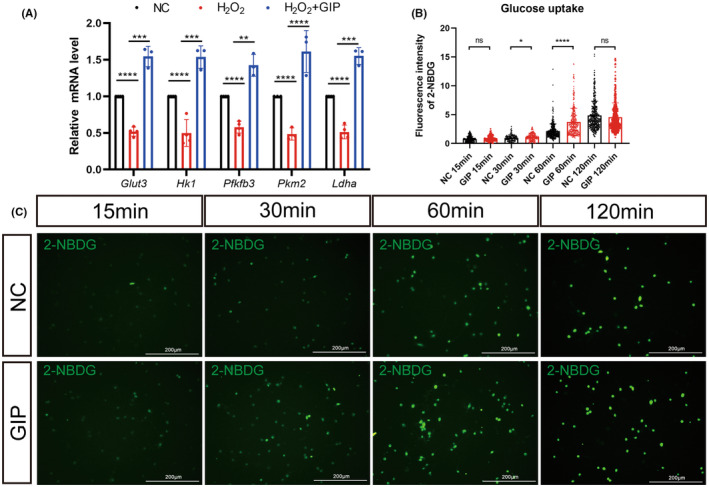
Effect of GIP on glucose uptake in neurons. (A) GIP increased the mRNA level of Glut3, Hk1, Pfkfb3, Pkm2, and Ldha in neurons after H2O2 treatment. n = 3. The data were normalized by NC and shown as mean ± SE, analyzed by one‐way ANOVA, **p < 0.01, ***p < 0.001, ****p < 0.0001. (B, C) GIP augmented glucose uptake in cultured neurons. Statistical results and representative images were shown in B and C. n = 150 neurons, N = 3 rats, the experiment repeated three times independently. The data were shown as mean ± SE, analyzed by Student's t‐test vs. NC 15 min, NC 30 min, NC 60 min, and NC 120 min, ns represents no statistical difference, *p < 0.05, ****p < 0.0001. C: Scale Bar = 200 μm.
