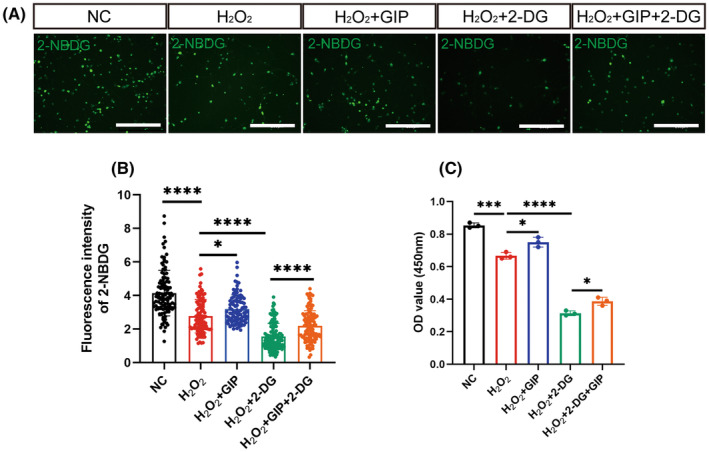
FIGURE 6.

GIP‐protected neurons from oxidative damage by regulating glucose transport. (A) Representative immunostaining result of 2‐NBDG (Green) after GIP and 2‐DG treatment. Scale Bar = 200 μm. (B) Statistical result of 2‐NBDG fluorescence intensity. n = 100–150 neurons, N = 3 rats. The data were shown as mean ± SE, and were analyzed by one‐way ANOVA, *p < 0.05, ****p < 0.0001. (C) Statistical result of OD value at 450 nm. n = 3. The data were shown as mean ± SE, and were analyzed by one‐way ANOVA, *p < 0.05, ***p < 0.001, ****p < 0.0001.
