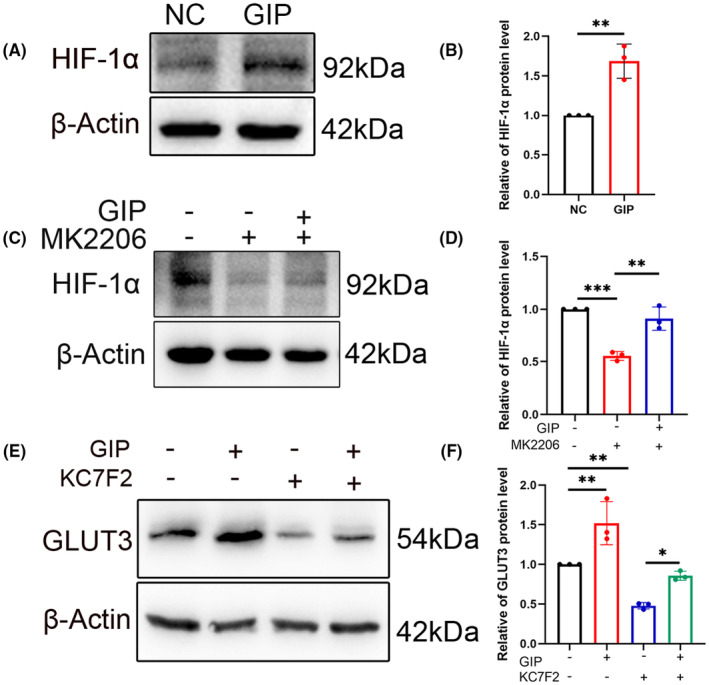
FIGURE 8.

GIP increased GLUT3 expression via HIF‐1α/Akt pathways in neurons. (A, B) GIP treatment increased HIF‐1α level. n = 3. The data were shown as mean ± SE, analyzed by Student's t‐test, **p < 0.01. (C, D) Akt inhibitor MK2206 reduced HIF‐1α level both in the presence and absence of GIP. n = 3. The data were shown as mean ± SE, analyzed by one‐way ANOVA, **p < 0.01, ***p < 0.001. (E, F) HIF‐1α inhibitor attenuated GIP‐induced upregulation of GLUT3. n = 3. The data were shown as mean ± SE, analyzed by one‐way ANOVA. *p < 0.05, **p < 0.01.
