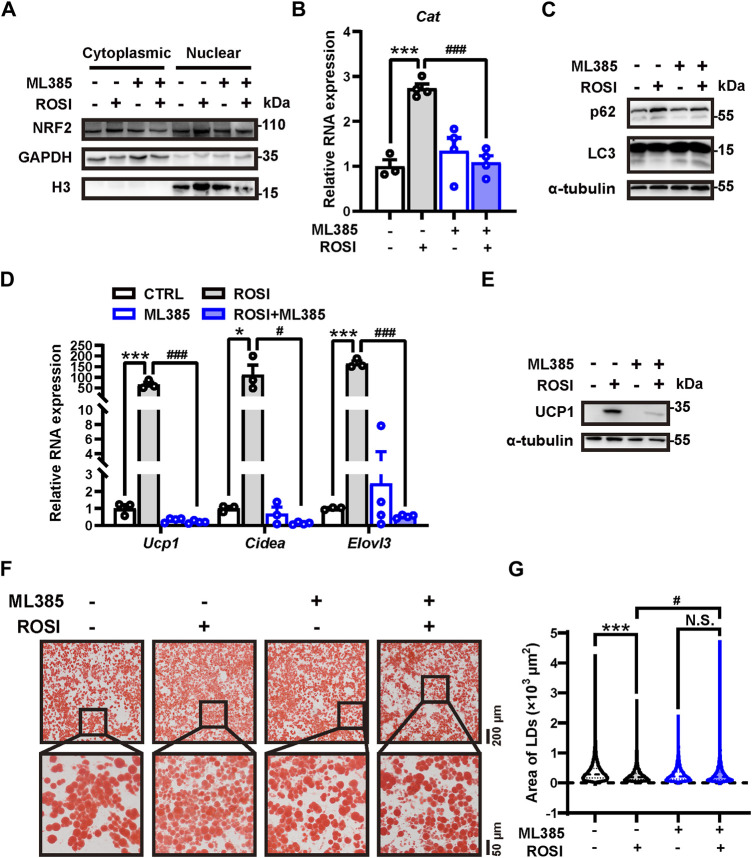
FIGURE 5.
Rosiglitazone inhibits autophagy and promotes adipocyte browning through NRF2 activation (A–G) OA-induced whitened adipocytes were treated with rosiglitazone (ROSI, 10 μM) and ML385 (10 μM) for 4 days. (A) NRF2 protein levels in cytoplasmic and nuclear proteins of cultured adipocytes were measured by Western blotting. GAPDH was blotted as a loading control of cytoplasmic proteins, and H3 was blotted as a loading control of nuclear proteins. (B) Total RNA levels of Cat were measured by qRT-PCR (n = 3–4 trials). (C) p62 and LC3 protein levels were measured by Western blotting. α-Tubulin was blotted as a loading control. (D) Total RNA levels of Ucp1, Cidea, and Elovl3 were measured by qRT-PCR (n = 3–4 trials). (E) UCP1 protein levels were measured by Western blotting. α-Tubulin was blotted as a loading control. (F) Lipid droplets in adipocytes were marked by Oil Red O staining (n = 3 trials). The square box shows the zoomed-in view of the indicated image. Upper scale bar, 200 μm; lower scale bar, 50 μm. (G) Quantification of lipid droplets’ size from Oil Red O staining shown in (F). (n = 1,800–3,000 lipid droplets per group) Data in (B,D, G) are shown as mean ± SEM. Statistical analysis was performed by one-way ANOVA and nonparametric test with Tukey’s multiple comparisons in (B) and (D) and Dunn’s multiple comparisons in (G). *p < 0.05; ***p < 0.001 versus CTRL. #p < 0.05; ###p < 0.001 versus ROSI.

