
Figure 6.
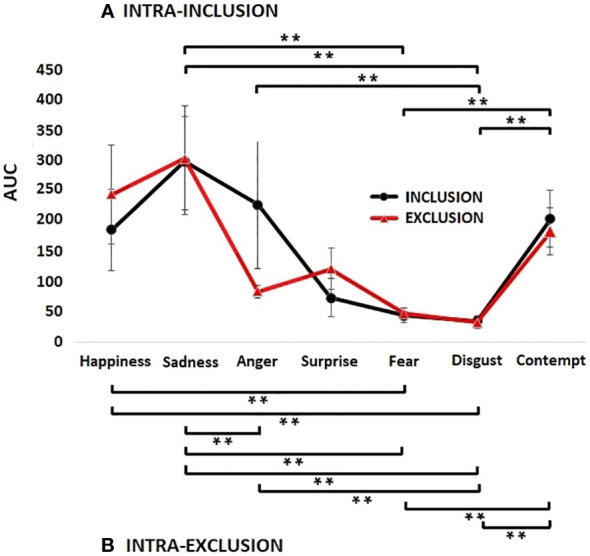
Mean values and standard errors of the total areas under the curve for each emotion during the condition of social inclusion (black lines) and social exclusion (red lines) while patients with Borderline Personality Disorder performed the Cyberball paradigm. Although surprise was nearly significant (p< 0.08) there were no significant differences between emotions across conditions. Significant differences between emotions of the same condition were represented with brackets for the condition of inclusion (A) and for the condition of exclusion (B) (**, p< 0.001). In both conditions, sadness, happiness, and contempt were the emotions with the highest values, and fear and disgust were the emotions with the lowest values. Overall, during exclusion, statistically greater significant differences between emotions were found.