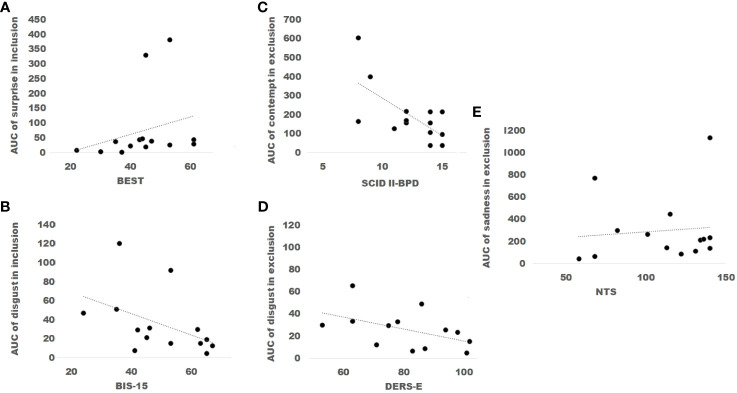
Figure 8.
The scores of the Borderline Evolution of Severity Over Time (BEST) were positively correlated with the values of the Area under the curve (AUC) of surprise during the condition of inclusion (A). In contrast, scores of the Barratt Impulsiveness Scale (BIS-15) were inversely correlated with the values of the AUC of disgust during inclusion (B). Scores of the Structured Clinical Interview for DSM-IV (SCID II- BPD) were inversely correlated with the values of the AUC of contempt during exclusion (C). Additionally, scores of the Difficulties in Emotion Regulation Scale, Spanish version, (DERS-E) were inversely correlated with the values of the AUC of disgust in the condition of exclusion (D). Finally, scores of the Need Threat Scale (NTS) were positively correlated with the values of the AUC of sadness in exclusion (E).

