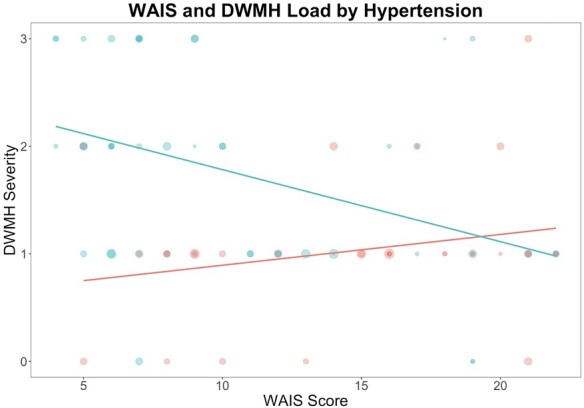
Figure 4.

Moderating effect of DWMH severity on the relationship between history of hypertension and WAIS score. DWMH severity is reported as the deep WMH Fazekas score for each participant. Red dots represent participants without hypertension; blue dots represent patients with hypertension. Dot size corresponds to lesion volume. Moderation analyses revealed the interaction between DWMH and hypertension explains 5.85% of the variance in the WAIS score (P = 0.0093).
