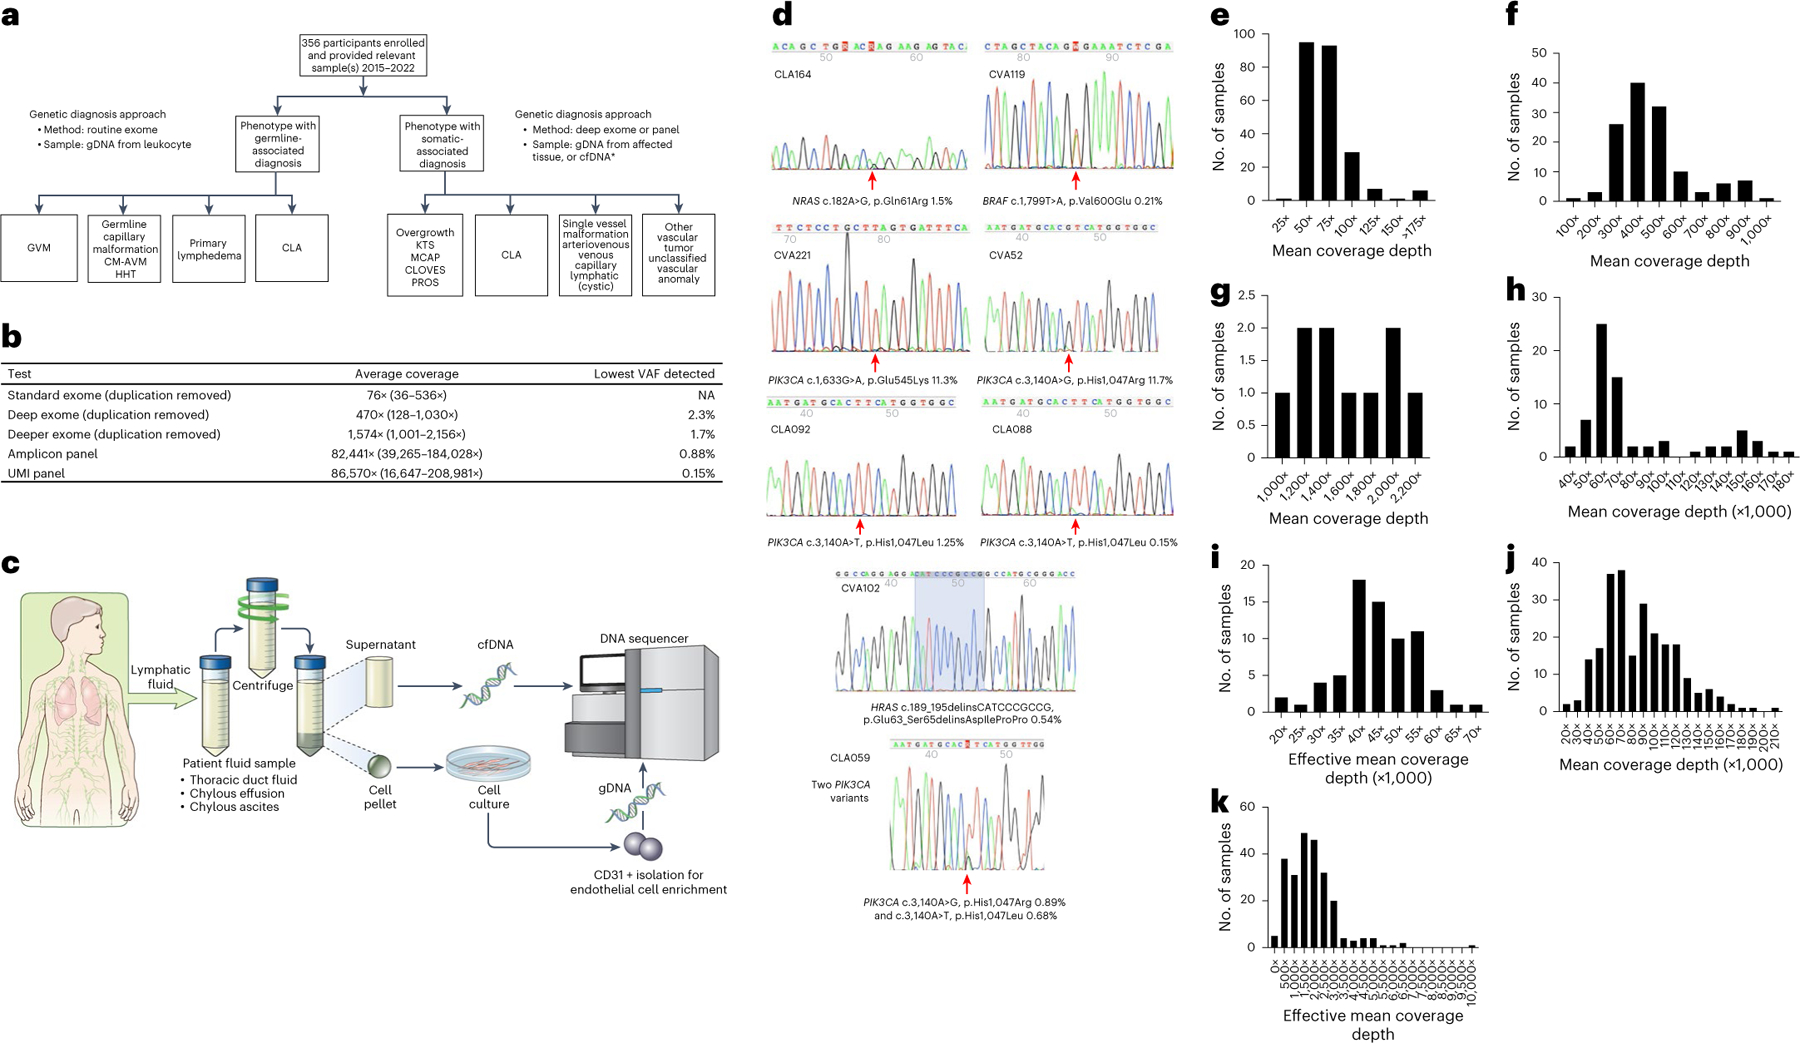
Fig. 2 |. Methods and technical aspects of the study.

a, Genetics study workflow. CLA includes CCLA, KLA, GLA, GSD and secondary CCLA. *Affected tissue samples included fresh, frozen or FFPE tissue, cell pellets from lymphatic fluid samples, endothelial cell enrichment from lymphatic fluid samples and cfDNA isolated from either plasma or lymphatic fluid. b, Average coverage depth and lowest VAF detected by different sequencing strategies. c, Lymphatic fluid analysis procedure. Thoracic duct fluid, chylous effusion or chylous ascites were collected as part of clinical care. An aliquot was provided to the research laboratory. The sample was centrifuged. Supernatant was used for cfDNA isolation. The cell pellet was dissociated, plated and grown under conditions that favor endothelial cell growth. If growth occurred, CD31 magnetic bead isolation was performed. Genomic DNA was isolated from this material. Both were used as samples for panel sequencing. d, Representative Sanger traces from BDA qPCR assays confirming the somatic variants identified (red arrows). e–k, Distribution of coverage of genomic sequencing. Mean coverage depth of routine exome sequencing was 76× with interquartile range (IQR) of 25 (e). Mean coverage depth of deep exome sequencing was 470× with IQR of 162 (f). Mean coverage depth of deeper exome sequencing was 1,574× with IQR of 726 (g). Mean coverage of amplicon ultra-deep panel sequencing was 82,441× with IQR of 37,290 (h). Effective mean coverage of amplicon ultra-deep panel sequencing was 44,941× with IQR of 11,383 (i). Mean coverage of UMI ultra-deep panel sequencing was 86,570× with IQR of 46,325 (j). Effective mean coverage of UMI ultra-deep panel sequencing after error correction was 1,892× with IQR of 1,346 (k).
