
Extended Data Fig. 1 |. Functional characterization of BRAF-F486S, RAF1-T145P, and KRAS-A146T.
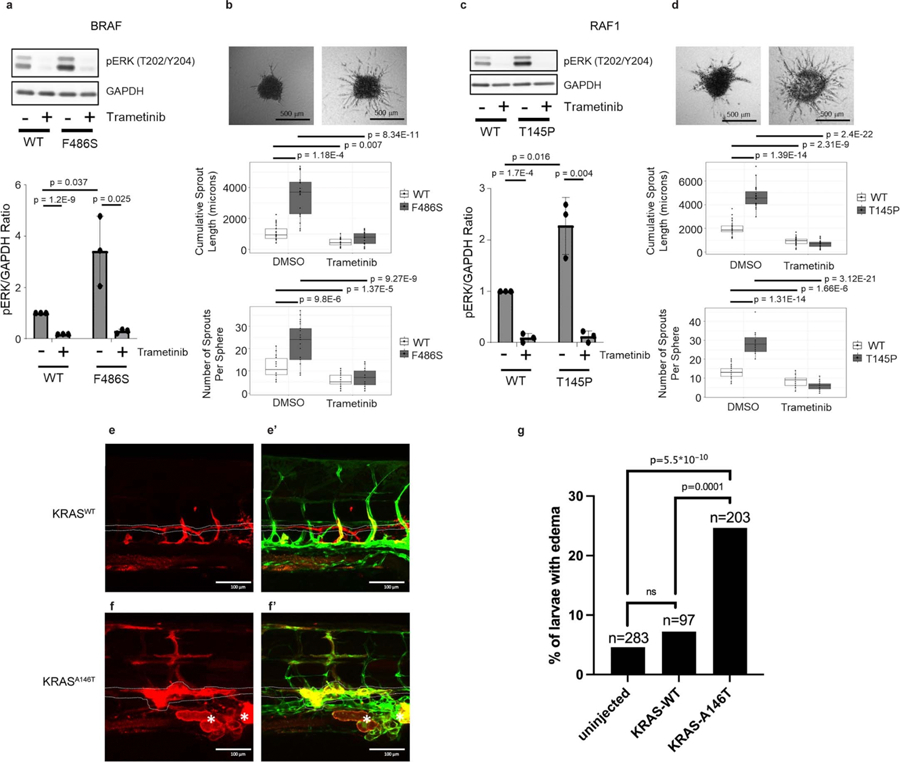
Transduction of BRAF-F486S (a) or RAF1-T145P (c) significantly increased the level of p-ERKs and Trametinib treatment led to a significant reduction of p-ERKs. Three-dimensional lymphatic spheroid sprouting assay showed elevated sprouting activity in HDLECs expressing BRAF-F486S (b) or RAF1-T145P (d) compared to its WT as measured by both cumulative sprout length and number of sprouts. Trametinib treatment led to a significant reduction of both cumulative sprout length and number of sprouts. For a-d, three independent experiments were performed. P values were calculated using 2-sided t-tests and included in each panel (degree of freedom was included in the Source Data for Extended Data Fig. 1), and corrected for multiple testing using the FDR (Benjamini and Hochberg) method. Bar graphs in panels a and c represent mean fold change in the ratio of pERK to GAPDH, normalized to the untreated wild type. Error bars represent standard deviations. In the box and whisker plots in panels b and d, the line in the middle of the box represents the medians, tops and bottoms of the boxes represent the 25th and 75th quartiles respectively, and the whiskers extend to 1.5 times the interquartile range beyond the 25th and 75th quartiles. All the data points that are summarized by the boxplots are superimposed as dots on the plots; minima and maxima can be determined by the highest and lowest dots. e, e’, Expression of KRASWT had no impact on lymphatic vessel morphology in trunk. f, f’, Expression of KRASA146T resulted in lymphatic tissue expansion (asterisks) and dilation of the thoracic duct (dotted line). Red: Expression of transgene in trunk of zebrafish at 5dpf, Green: mrc1a:GFF labeling lymphatic vessels. g, Quantitation of WT EK larvae that were assayed for pericardial edema at 5 dpf. Injected embryos were screened for transgenic mCherry expression in endothelial cells prior to quantitation so that only transgenic expressing embryos were counted. The p-values in the graph were calculated via Fisher’s Exact tests (two-sided) between samples as indicated, followed by Bonferroni correction. Indicated n are the total number of larvae assayed per condition.