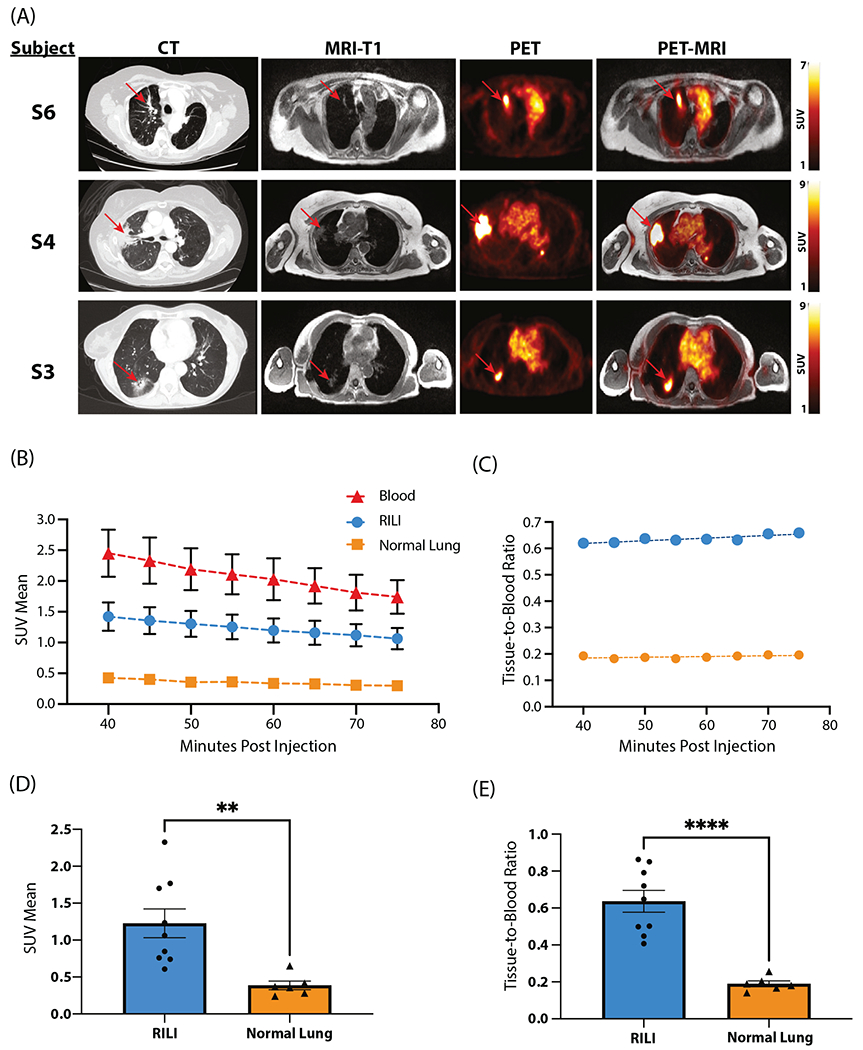
Fig. 6.

(A) Representative matching axial computed tomography (CT), magnetic resonance (MR), positron emission tomography (PET), and PET-MRI images of human participants with radiation-induced lung injury (RILI). Each row represents 1 individual. CT images (left) depict RILI in irradiated lung with characteristic consolidation and ground glass opacities. Red arrows indicate areas of RILI. Corresponding T1-weighted MR images obtained simultaneously with the PET study are shown in the second column. PET (third column) and fused PET-MRI images (fourth column) demonstrate elevated signal in areas of RILI following the injection of 68Ga-CBP8. (B-E) Quantitative analysis of 68Ga-CBP8 PET images in individuals with RILI. (B) 68Ga-CBP8 washout curves derived from dynamic PET images in areas of RILI, healthy lung, and blood pool. (C) Tissue-to-blood ratio for RILI and healthy lung. (D) Mean standardized uptake value (SUV) is significantly elevated in RILI versus in normal lung (P = .005). (E) Tissue-to-blood ratio is significantly elevated in RILI versus in normal lung (P < .001).
