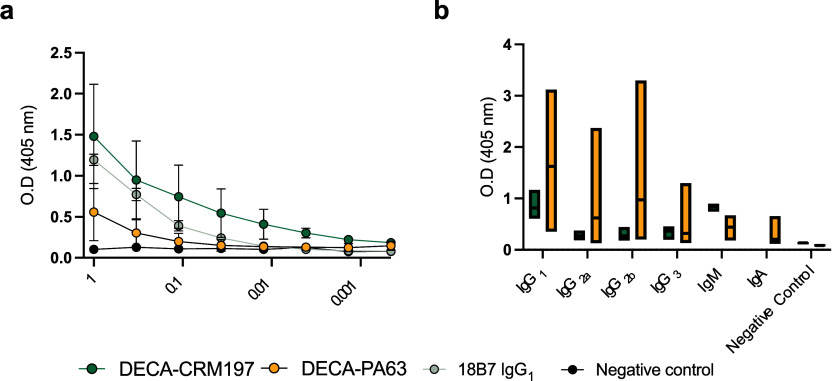
Figure 2.
(a) GXM ELISA of immunized mouse serum to EPS. For panel (a) each dot represents the mean, and bars represent standard deviation. A positive control of mAb 18B7 known to react with both GXM standards, and a negative control of PBS were used for the ELISA. (b) Isotype distribution of antibodies found in sera from the DECA-CRM197 and DECA-PA63 conjugates. For isotype determination, Indirect ELISA with CPS coating, followed by sera, and then antibodies of differing isotypes as indicated. All mice show predominantly IgG1 and IgM isotypes. For panel (b) the middle line in each bar indicates the mean, range is min to max. The serum for GXM reactivity and isotype analysis were isolated by retroorbital bleeding after the full immunization protocol. Experiments were repeated in triplicate.

