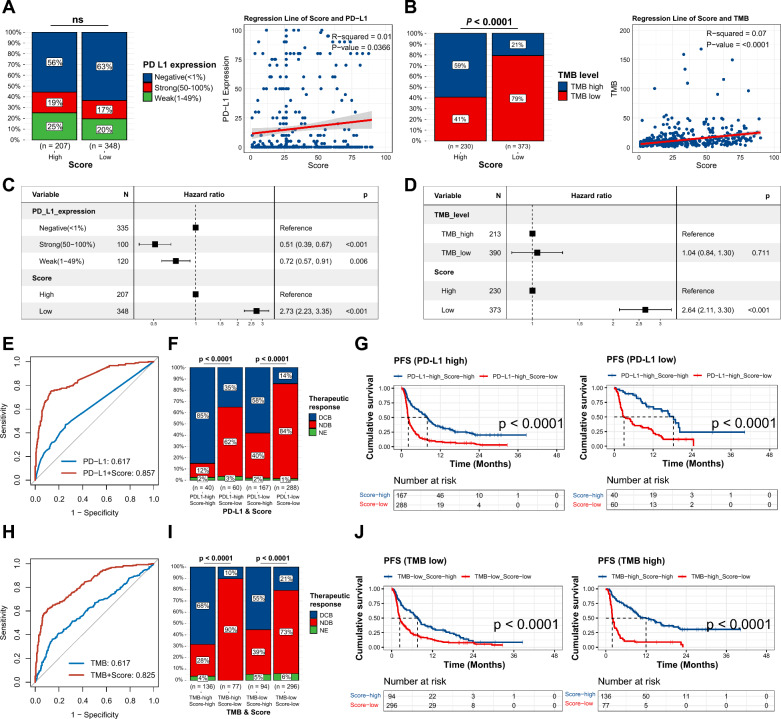
Fig. 3.
Variant allele frequency (VAF)-related stratification model in combination with programmed death-ligand 1 (PD-L1) or tumor mutation burden (TMB). A–B Comparison of PD-L1 and TMB between high- and low-score groups, and correlation analysis of model score with PD-L1 expression or TMB. PD-L1 expression was classified as negative (< 1%), weak (1–49%), and strong (50–100%). TMB was categorized as low (< 10 mut/Mb) and high (≥ 10 mut/Mb). Chi-square test and Pearson correlation analysis were conducted. C–D Multivariate Cox regression analysis of PD-L1 or TMB and the model. E Receiver operating characteristic (ROC) curve of PD-L1 alone and in combination with the model. F Proportion of durable clinical benefit (DCB) and no durable benefit (NDB) patients between high- and low-score groups in PD-L1 high and PD-L1 low groups, respectively. PD-L1 expression < 1% was considered PD-L1 low, while 1–100% was considered PD-L1 high. Chi-square test. G Kaplan–Meier (K-M) survival curve of progression-free survival (PFS) between high- and low-score groups in PD-L1 high and PD-L1 low groups, respectively. The p-value was calculated from log-rank test. H ROC curve of TMB alone and in combination with the model. I Proportion of DCB and NDB patients between high- and low-score groups in TMB-high and TMB-low groups, respectively. Chi-square test. J K-M survival curve of PFS between high- and low-score groups in TMB-high and TMB-low groups, respectively. The p-value was calculated from log-rank test

