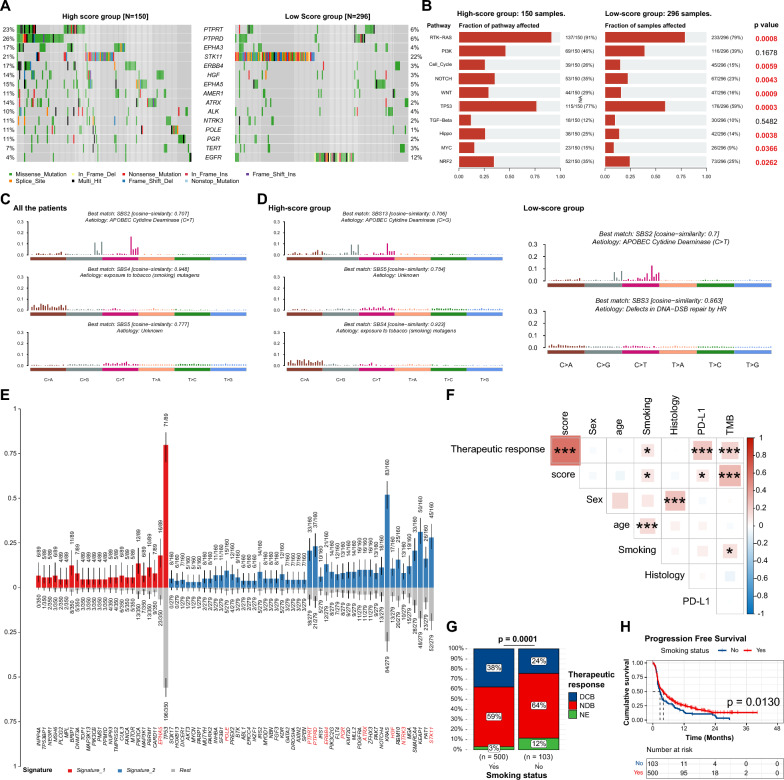
Fig. 4.
Mutational landscape profiling of VAF-related stratification system A Waterfall plot of the 15 genes involved in the model. B Oncogenic pathways enrichment analysis. C Signature analysis in all patients. D Signature analysis in high-score and low-score groups, respectively. E Characteristic genes of the signatures. Red bars are the characteristic genes in signature 1. Blue bars are the characteristic genes in signature 2. The red genes below are involved in the VAF-related stratification model. A p-value < 0.05 was considered statistically significant. F Correlation analysis of model score with clinical parameters using Pearson correlation analysis. Levels of significance: *: P < 0.05; **: P < 0.01; ***: P < 0.001. G Proportion of durable clinical benefit (DCB) and no durable benefit (NDB) patients between smoking and non-smoking groups. Chi-square test. H Comparison of Kaplan-Meier K–M survival curve of progression-free survival (PFS) between smoking and non-smoking groups. The p-value was calculated from log-rank test.

