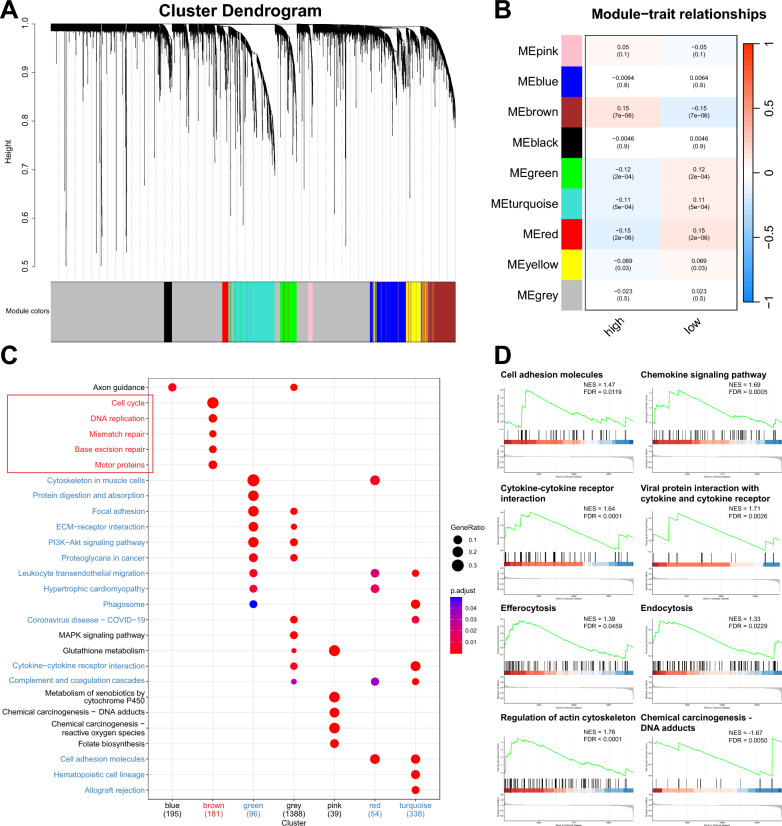
Fig. 5.
Transcriptomic landscape mapping of the dysregulated pathways in VAF-related stratification system A Clustering dendrogram obtained by average linkage hierarchical clustering. The color row underneath the dendrogram shows the module assignment determined by the Dynamic Tree Cut. B Module-trait relationships. Each row corresponds to one module eigengene (labeled by color). Blue color represents a negative correlation, while red represents a positive correlation. Pearson correlation coefficient (p-value). C Kyoto encyclopedia of genes and genomes (KEGG) module enrichment analysis. Red modules and pathways are positively related to the high-score group. Blue modules and pathways are negatively related to the low-score group. Fisher's exact test. The adjusted p-value was calculated by Benjamini and Hochberg false discovery rate (FDR) method. FDR < 0.05 was considered statistically significant. The plot showed the top 5 pathways of each module. D Pathways enriched in the high- and low-score group in Gene set enrichment analysis (GSEA) of the whole gene set. NES, normalized enrichment risk. NES > 0 indicated the pathway was enriched in the low-score group. NES < 0 indicated the pathway was enriched in the high-score group. FDR, false discovery rate. FDR < 0.05 was considered statistically significant.

