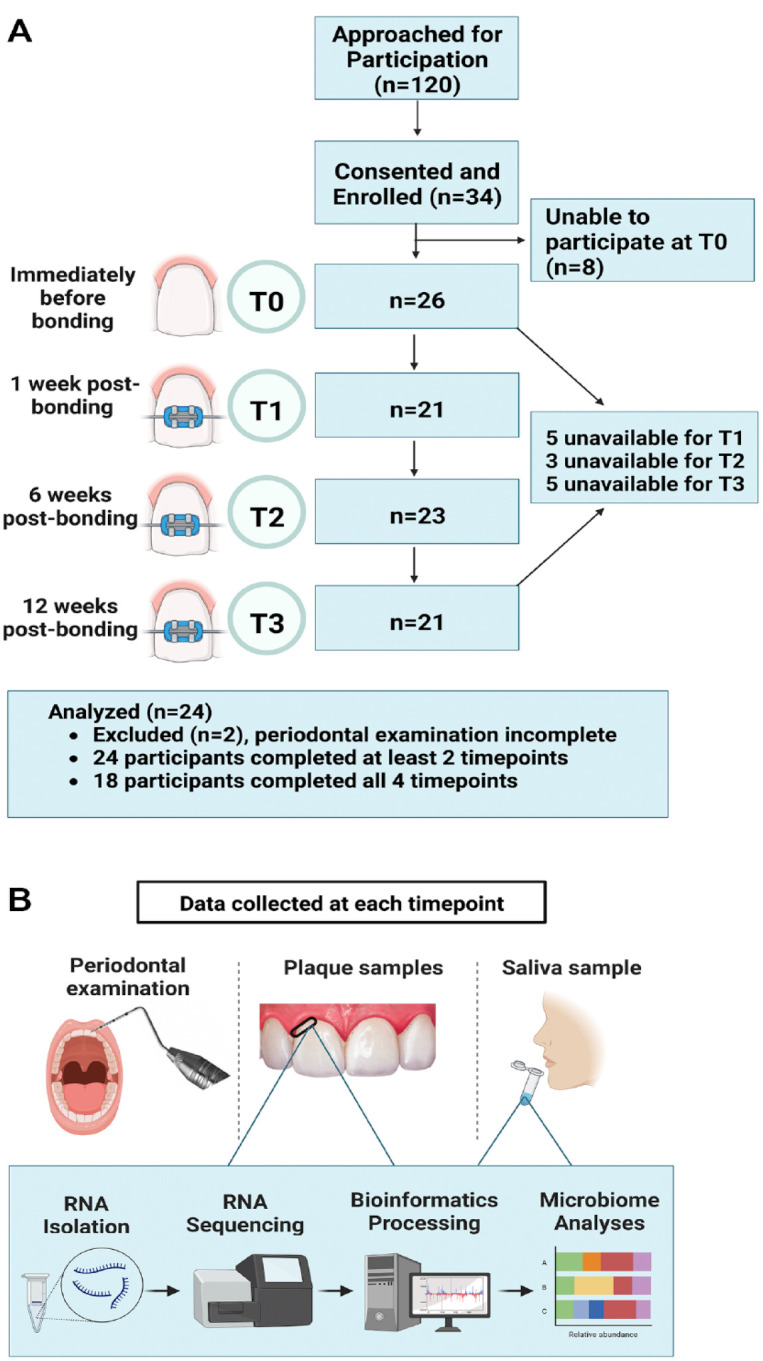
Figure 1.

Study summary. (A) Flow diagram demonstrating the progression of patients through the longitudinal study. (B) Overview of study design illustrating the visit events at each time point. T0 = day of bonding—before bonding; T1 = 1 wk postbonding; T2 = 6 wk postbonding; T3 = 12 wk postbonding. Clinical measures were scored by calibrated examiners at each visit. Supragingival plaque and saliva samples were collected. RNA was isolated and sequenced, followed by bioinformatics processing and microbiome analyses.
