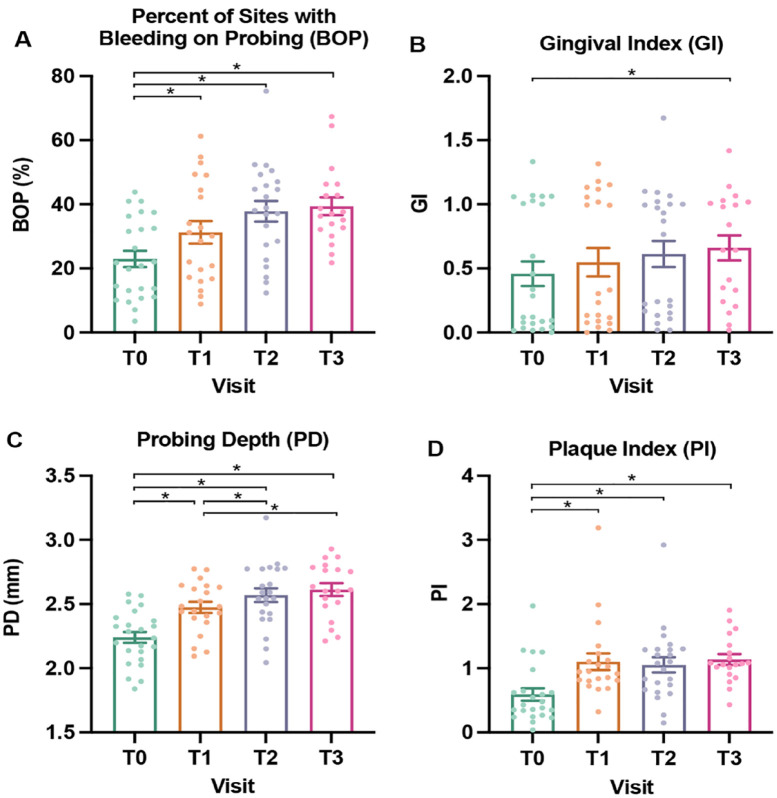
Figure 2.
Longitudinal changes in measures of oral health. (A) Mean percentage of sites with bleeding on probing (BOP), scored 0/no or 1/yes. (B) Mean gingival index (GI), scored 0 to 3. (C) Mean probing depth (PD) measured in millimeters. (D) Mean plaque index (PI), scored 0 to 5. T0, baseline, day of bonding, green; T1, 1 wk postbonding, orange; T2, 6 wk postbonding, purple; T3, 12 wk postbonding, red. Individual participant data are indicated with each dot. Mean value is indicated with the bar along with standard error. Pairwise P values were computed using least square means from the linear mixed model, with Tukey adjustment for multiple testing. Significance threshold P < 0.05. Significant P values indicated with a bracket and asterisk (*).

