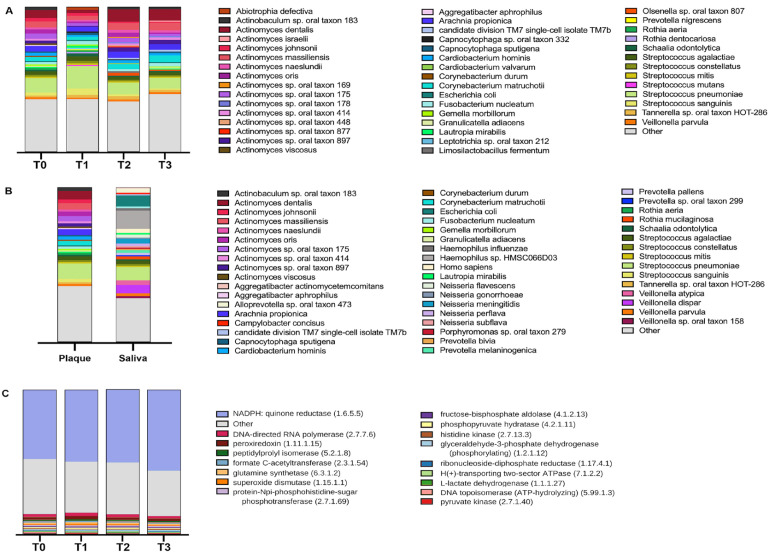
Figure 3.
Diversity analyses of plaque and saliva. (A) Plaque species taxonomic profiles by visit (T0, baseline, day of bonding; T1, 1 wk postbonding; T2, 6 wk postbonding; T3, 12 wk postbonding). (B) Taxonomic profiles of species found in plaque and saliva samples at T0. Top 45 most abundant species listed alphabetically with color legend. (C) Relative abundance of 17 most abundant enzymes in plaque at time points T0 to T3.

