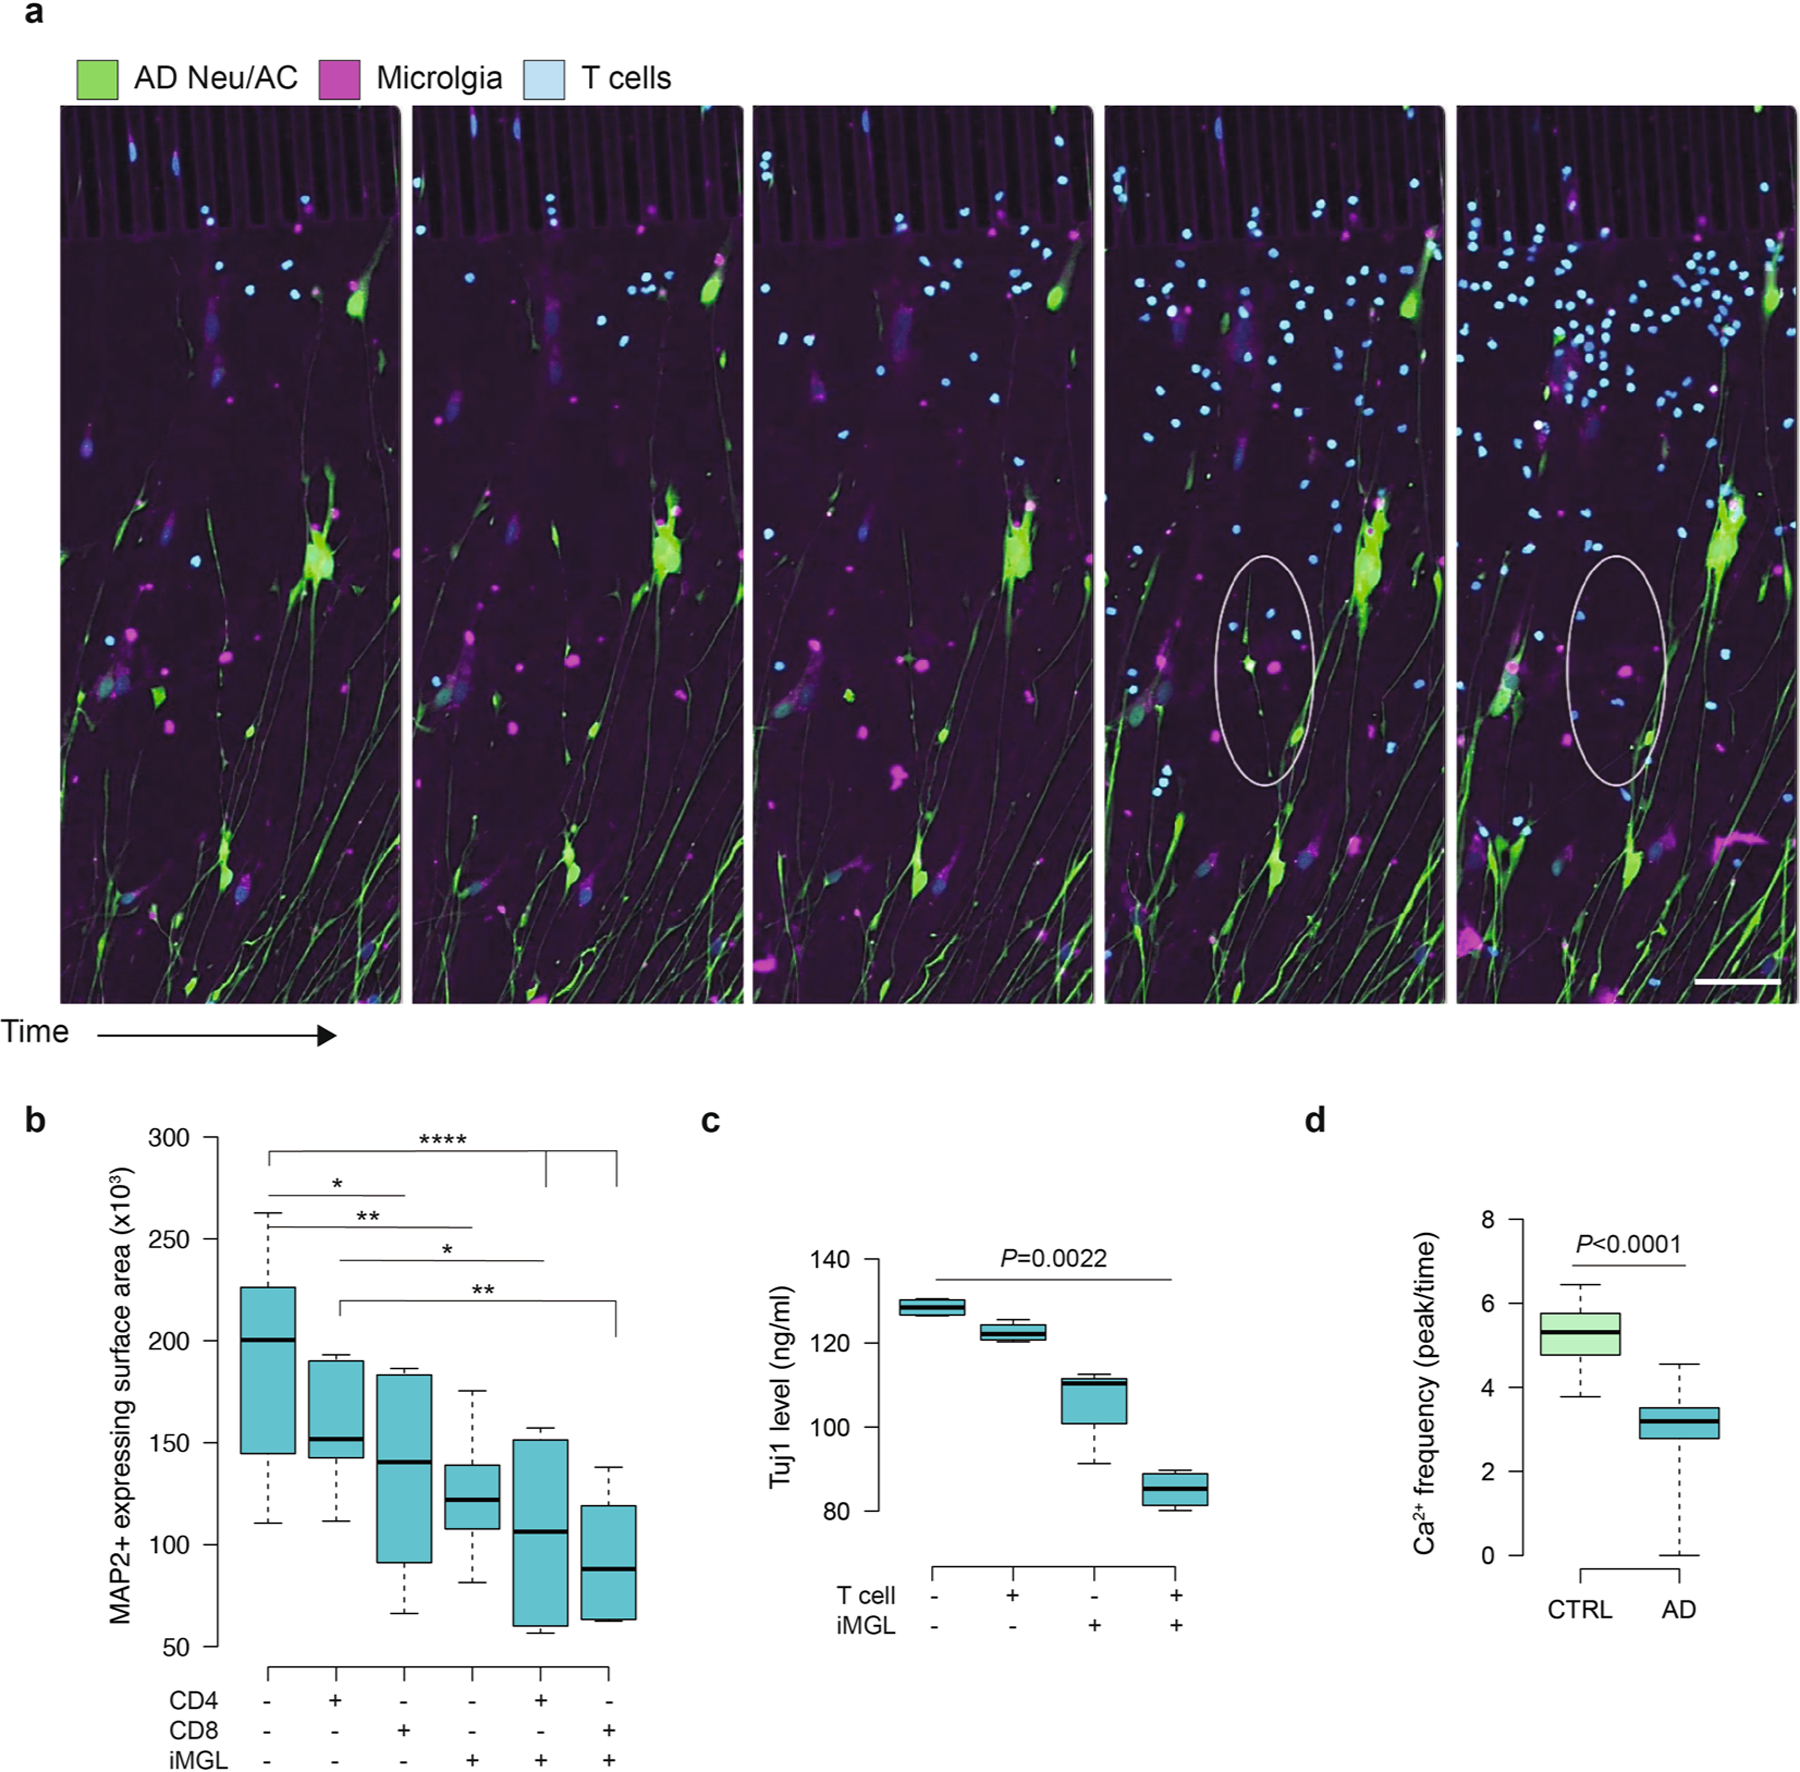
Extended Data Fig. 3 |. Infiltrating T cells exacerbate neuronal damage in the presence of microglia in AD.

a, Time-lapse confocal imaging showing neurite cleavage in AD cultures. Scale bar, 100 μm. The circled area shows depletion of cells (GFP+ cells) in the presence of microglia and T cells in AD condition. b, Box plots represent quantification of neuronal (MAP2+ expressing surface area) damage in AD Neu/AC (+/−) iMGL conditions in the presence of CD4+ or CD8+ T cells (n = 10 independent ROIs from 4 independent experiments; P-values from two-way ANOVA with Tukey multiple comparisons tests). c, Box plots represent quantification of neuronal damage using ELISA assay for Tuj1 in AD Neu/AC (+/−) iMGL conditions in the presence of CD3+ T cells (n = 4 independent experiments; P-values from nonparametric, Kruskal-Wallis test with Dunn’s multiple comparisons test). d, Box plots represent quantification of calcium dynamics in AD cultures in the presence of T cells compared to CTRL, as monitored using Cal-520 AM, a Ca2+ indicator (n = 251 independent ROIs, CTRL and n = 222, AD from 5 independent experiments; P-values from nonparametric, two-sided, Mann-Whitney test). (b–d) In the boxplots, the center lines show the medians; box limits indicate the 25th and 75th percentiles; whiskers extend to minimum and maximum values.
