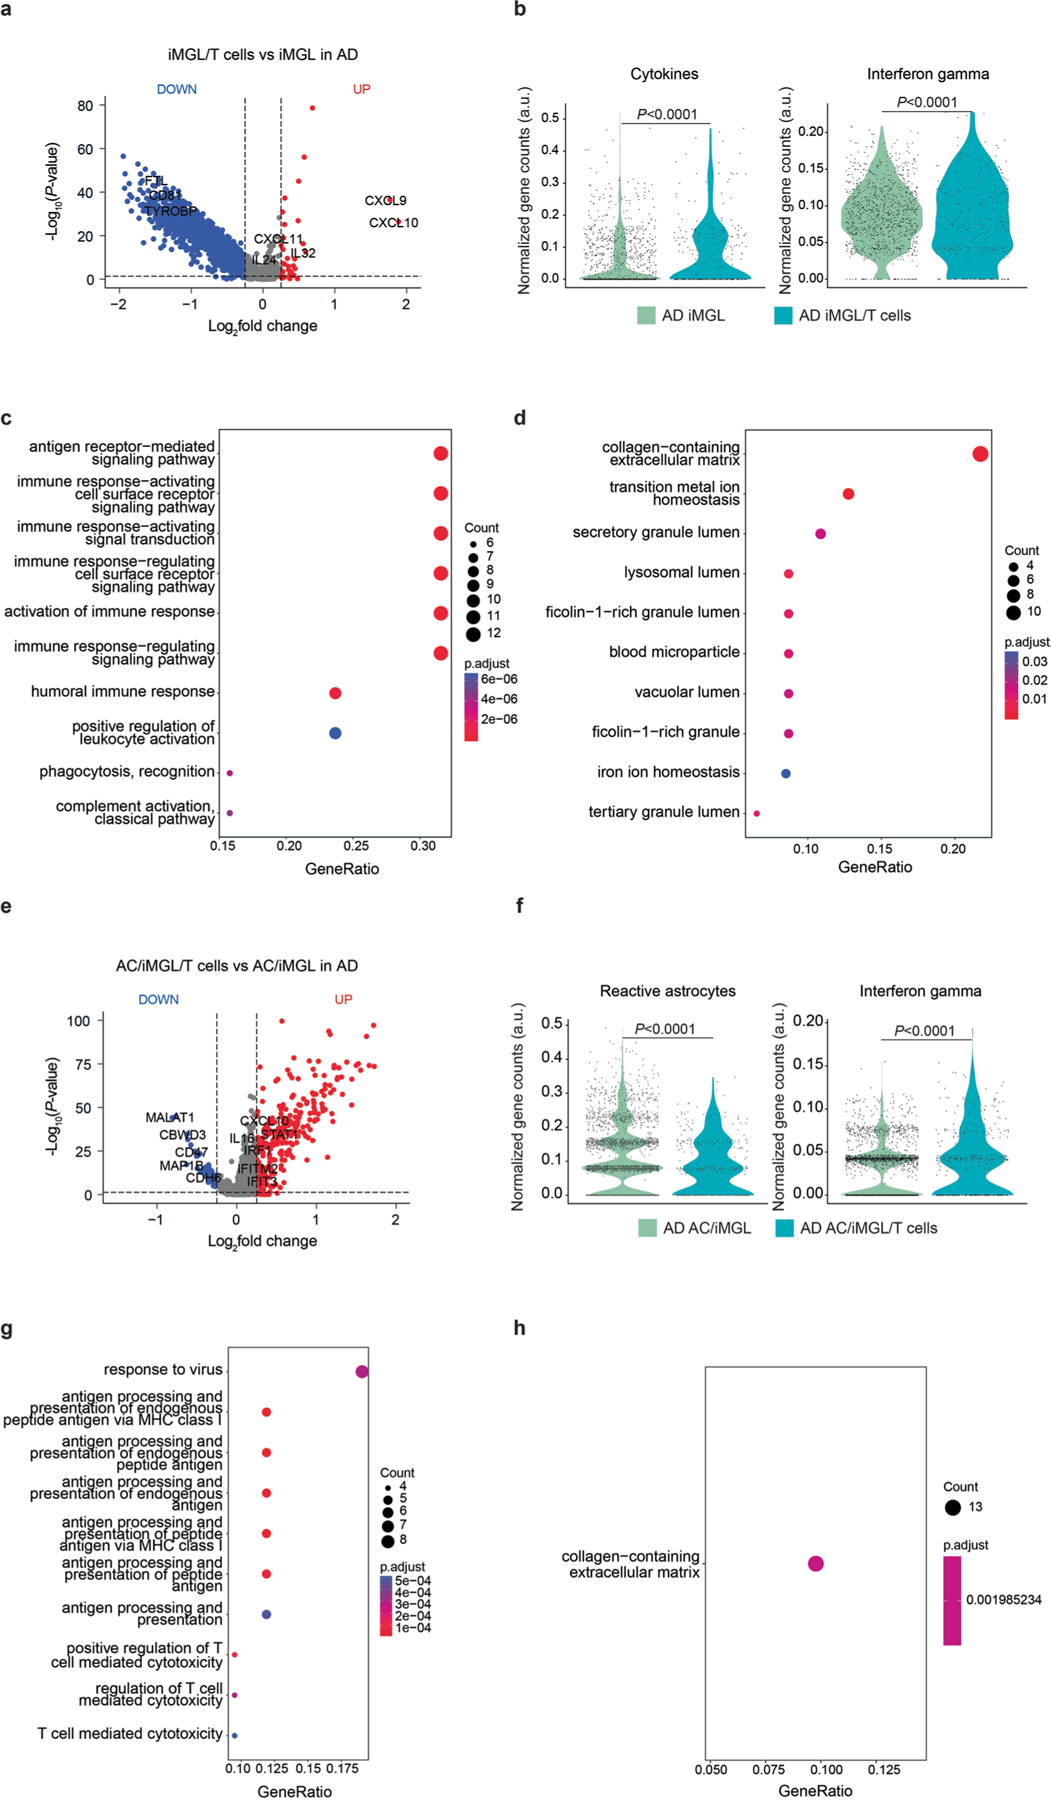
Extended Data Fig. 6 |. Interferon-associated pathways are enriched in glial cells following infiltration of T cells in AD.

a, Volcano plot of differentially expressed genes in microglia in the presence of infiltrating T cells in AD cultures compared to AD cultures lacking T cells. Significantly upregulated (P < 0.05 and FC > 0.1) and downregulated (P < 0.05 and FC < 0.1) genes are shown in red and blue dots, respectively (P-values from Wilcoxon Rank Sum test). b, Violin plots of highly enriched genes associated with cytokines (ARF1, CXCL9, CXCL10, CXCL16, CXCL8, CXCL14, CXCL5, IL24, IL32, IL17RA, IL1B, IL10, IL21R, IL18, IL6R, IL7R) and interferon-associated genes (NR1H3, CDC37, OTOP1, HCK, HPX, IRGM, IFNG, IFNGR1, IFNGR2, IRF1, JAK1, JAK2, ARG1, PARP14, PPARG, MED1, PTPN2, SP100, STAT1, TP53, TXK, NR1H2, PARP9, NLRC5, SOCS1, NMI) in microglia in the presence of infiltrating T cells in AD compared to AD cultures lacking T cells (P-values from nonparametric, two-sided, Mann-Whitney test). c, d, Gene ontology of significantly upregulated (c) and downregulated (d) pathways in microglia in the presence of infiltrating T cells in AD cultures vs AD cultures lacking T cells. Color scale indicates the adjusted P-value for significantly enriched pathways in microglia, and dot size is proportional to the count of genes (P-values were calculated from a Fisher exact test and the adjusted p-values given by Benjamini & Hochberg method). e, Volcano plot of differentially expressed genes in astrocytes in the presence of microglia and infiltrating T cells in AD compared to AD cultures lacking T cells. Significantly upregulated (P < 0.05 and FC > 0.1) and downregulated (P < 0.05 and FC < 0.1) genes are shown in red and blue dots, respectively. f, Violin plots of highly enriched genes associated with reactive astrocytes (GFAP, ALDOC, FABP7, TSPO, CRYAB, HSPB1, C3, CHI3L1, NTRK2, S100B, SOX9, STAT3) and interferon-associated genes (NR1H3, CDC37, OTOP1, HCK, HPX, IRGM, IFNG, IFNGR1, IFNGR2, IRF1, JAK1, JAK2, ARG1, PARP14, PPARG, MED1, PTPN2, SP100, STAT1, TP53, TXK, NR1H2, PARP9, NLRC5, SOCS1, NMI) in astrocytes in the presence of microglia and infiltrating T cells in AD compared to AD cultures lacking T cells (P-values from nonparametric, two-sided, Mann-Whitney test). g, h, Gene ontology of significantly upregulated (g) and downregulated (h) pathways in astrocytes in the presence of microglia and infiltrating T cells in AD compared to AD cultures lacking T cells. Color scale indicates the adjusted P-value for significantly enriched pathways in microglia, and dot size is proportional to the count of genes (P-values were calculated from a Fisher exact test and the adjusted p-values given by Benjamini & Hochberg method).
