
Extended Data Fig. 7 |. NicheNet analysis of upstream ligand-receptor pairs inducing the DE genes of neurons, astrocytes, and microglia upon T-cell infiltration.
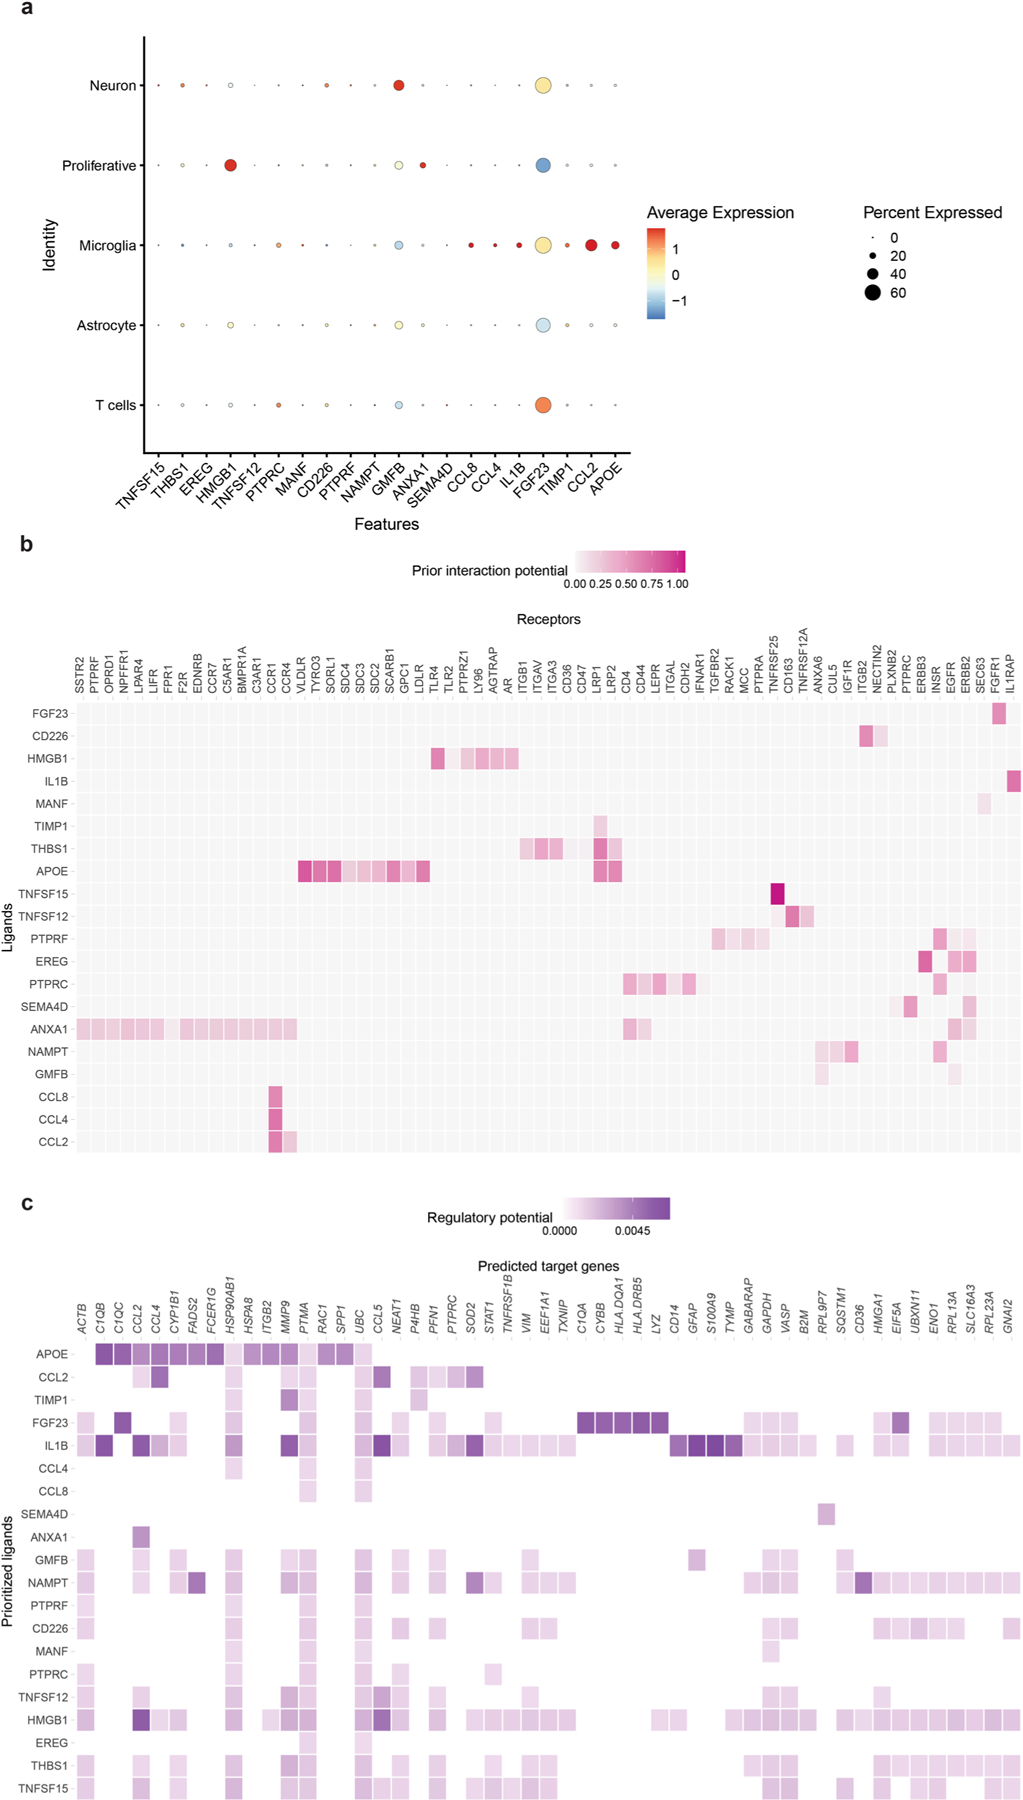
a, Dot plot of identity genes for distinct cell types. Color scale (a.u.) indicates the average expression of identity genes in each cell population, and the dot size is proportional to the percentage of cells expressing the identity genes. b, NicheNet’s ligand–target analysis represents potential upstream receptors expressed by neurons, astrocytes, microglia, and T cells associated with the top 20 potential ligands. c, Predicted target genes of the top 20 of potential ligands in AD Neu/AC/iMGL/T-cell cultures vs CTRL.