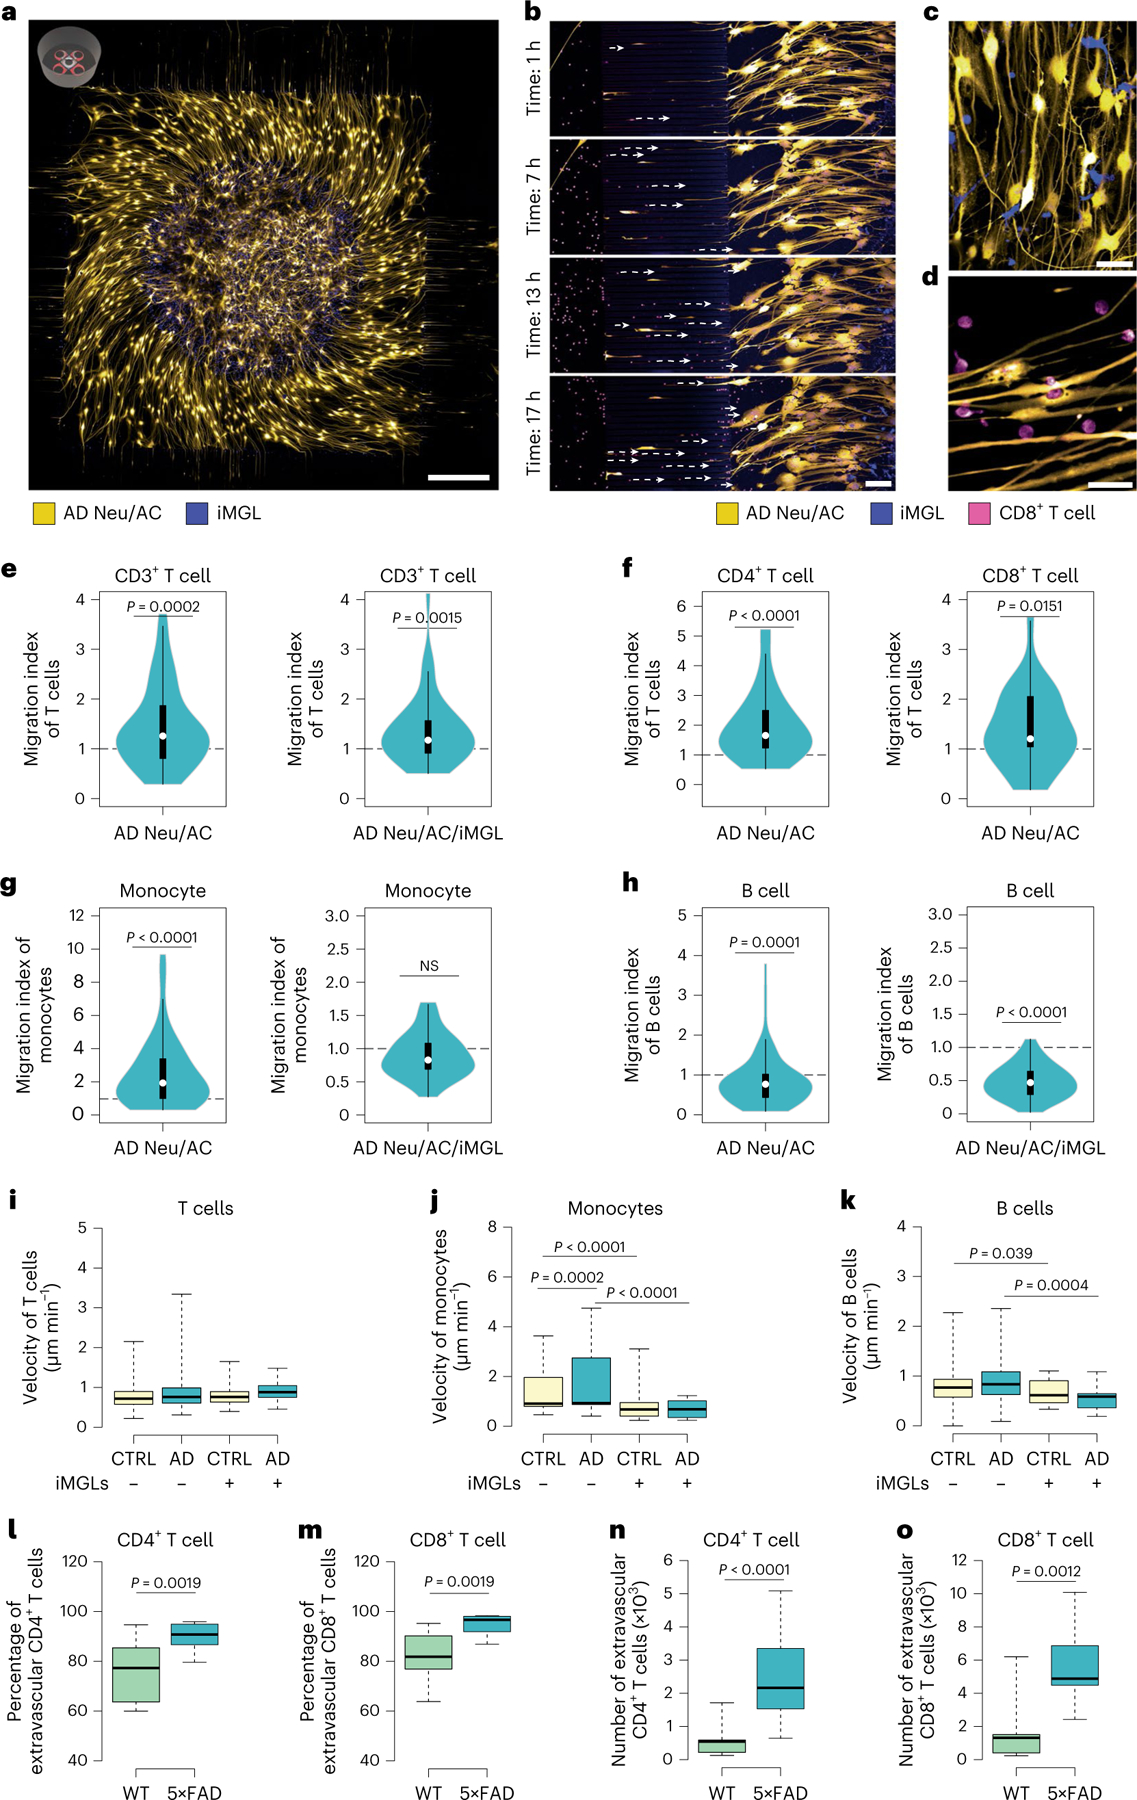
Fig. 2 |. Selective infiltration of T cells into the AD cellular models and 5×FAD mice.

a, Representative confocal imaging of 3D-differentiated AD Neu/AC/iMGL cultures in the PiChip system (Neu/AC, yellow; iMGL, blue). Scale bar, 500 μm. b, Time-lapse confocal imaging showing migration of CD8+ T cells (nuclei stained, magenta) through microchannels over time toward the PiChip BRAIN compartment containing AD cultures (Neu/AC, yellow; iMGL, blue). Scale bar, 100 μm. c, High magnification of the 3D-differentiated AD Neu/ACs (yellow) and iMGLs (blue) in the BRAIN compartment. Scale bar, 20 μm. d, High magnification of infiltrating CD8+ T cells (nuclei stained, magenta) and AD Neu/ACs (yellow) in the BRAIN compartment. Scale bar, 20 μm. e–h, The migration index of CD3+ T cells (n = 68 biological replicates, AD Neu/AC and n = 40, AD Neu/AC/iMGL) (e), CD4+ and CD8+ T cells (n = 32 biological replicates, CD4+ and n = 26, CD8+ T cells) (f), monocytes (n = 60 biological replicates, AD Neu/AC and n = 29, AD Neu/AC/iMGL) (g) and B cells (n = 89 biological replicates, AD Neu/AC and n = 37, AD Neu/AC/iMGL) (h) in the PiChip system. P values are from two-tailed, Wilcoxon’s signed-rank tests and five or six independent experiments. i–k, Migration velocity of CD3+ T cells (n = 40–78 biological replicates) (i), monocytes (n = 28–86 biological replicates) (j) and B cells (n = 29–111 biological replicates) (k) via confined microchannels in the PiChip system. P values are from two-way analysis of variance (ANOVA) with Tukey’s multiple-comparison test and five or six independent experiments. l–o, The percentage (l and m) and absolute number (n and o) of extravascular CD4+ and CD8+ T cells in 5×FAD and WT brains (n = 12 mice each for WT and 5×FAD for CD4+ T cells, n = 9 mice each for WT and 5×FAD for CD8+ T cells). P values are from a nonparametric, two-sided Mann–Whitney U-test. In e–h, the white circles show the medians, the box limits indicate the 25th and 75th percentiles and the whiskers extend 1.5× the interquartile range (IQR) from the 25th and 75th percentiles; polygons represent density estimates of data and extend to extreme values. In i–o, The center lines show the medians, the box limits indicate the 25th and 75th percentiles and the whiskers extend to minimum and maximum values.
