
Fig. 5 |. Upregulation of CXCL10 in the AD neuroimmune axis model and 5×FAD brain.
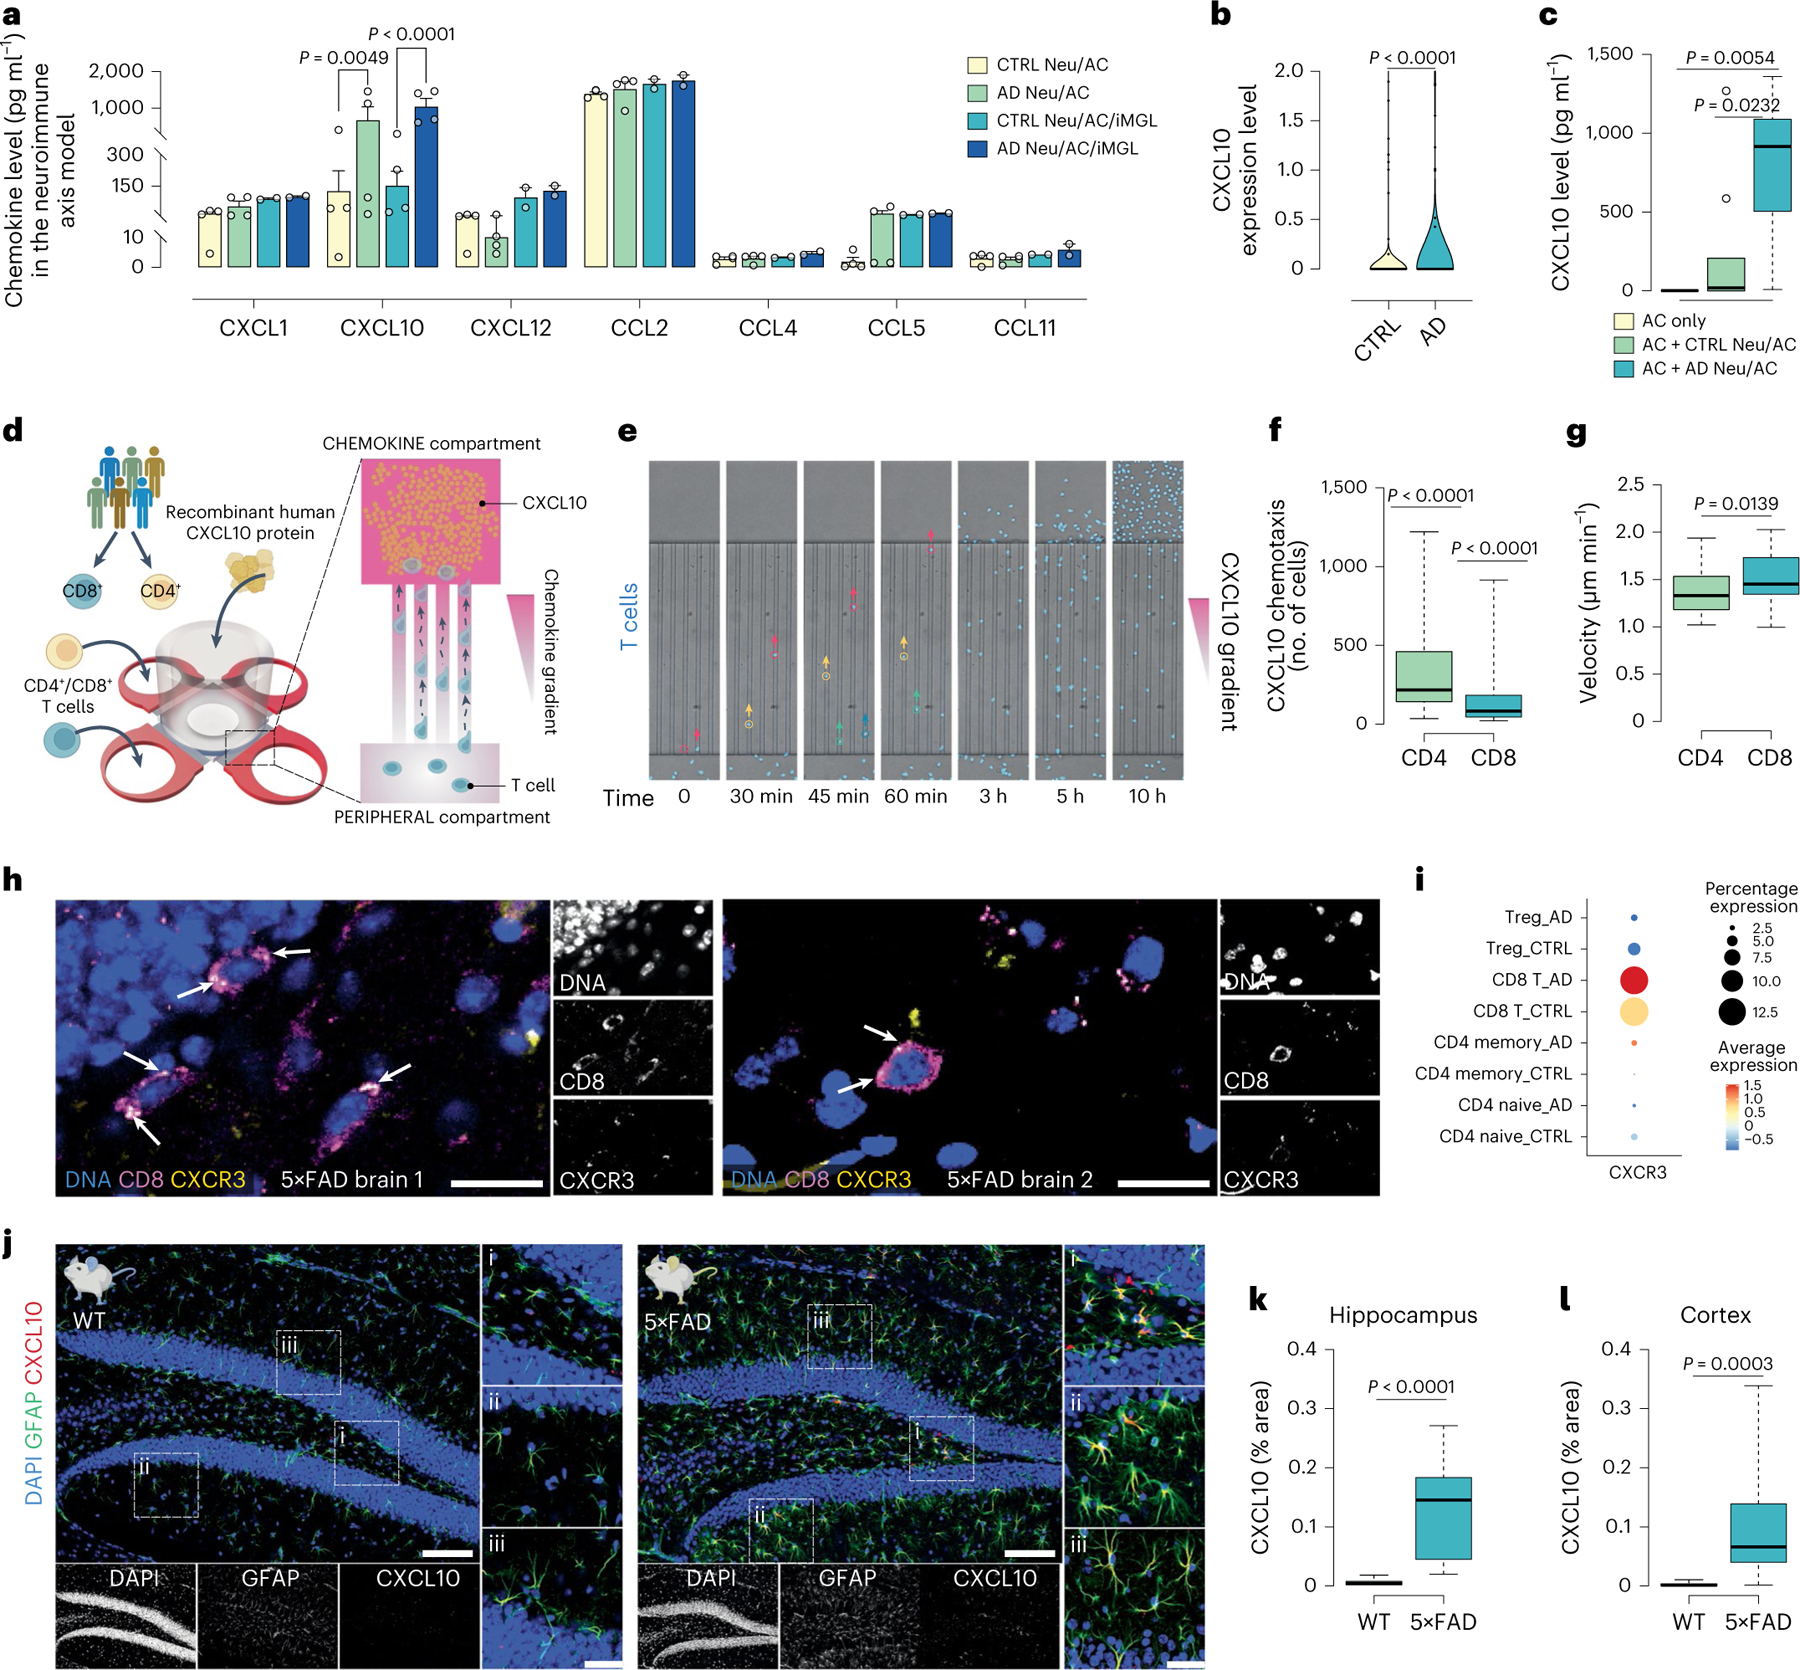
a, Quantification of chemokines in AD Neu/AC ± iMGL cultures compared with CTRL (n = 4 independent experiments all Neu/AC cultures; n = 2 for Neu/AC/iMGL cultures except CXCL10, n = 4; data are mean ± s.e.m.) P values are from two-way ANOVA with Tukey’s multiple-comparison test. b, ScRNA-seq data showing highly enriched astrocytic CXCL10 expression in AD cultures compared with CTRL (n = 5 independent experiments). P values are from a nonparametric, two-sided Mann–Whitney U-test. c, CXCL10 protein level from ACs in the presence of AD and CTRL cultures (n = 9 biological replicates except for AC only, n = 7) P values are from a nonparametric Kruskal–Wallis test with Dunn’s multiple-comparison test. d, Schematics describing an in vitro chemotaxis model where recombinant human CXCL10 was added to the CHEMOKINE compartment, whereas CD4+ and CD8+ T cells were added to the PERIPHERAL compartment. e, Time-lapse microscopy imaging showing chemotaxis of T cells (nuclei stained, blue) toward CXCL10 through confined microchannels over time. f, The number of migrated CD4+ and CD8+ T cells in response to CXCL10 (100 nM) after 17 h (n = 44 biological replicates, CD4+ and n = 47, CD8+). P values are from two-tailed, Wilcoxon’s signed-rank tests. g, Migration velocity of CD4+ and CD8+ T cells through microchannels over 17 h toward CXCL10 (100 nM) (n = 44 biological replicates, CD4+ and n = 47, CD8+). P values are from a nonparametric, two-sided Mann–Whitney U-test. h, Representative immunofluorescence staining of CD8+ T cells (magenta), co-labeled with CXCR3 (yellow) and DAPI (nuclei) in 6- to 7-month-old 5×FAD mouse brains. Scale bar, 20 μm. i, CXCR3 expression for distinct T cell types in different conditions using scRNA-seq data. The color scale (arbitrary units (a.u.)) indicates the average expression of the CXCR3 gene in each cell population and the dot size is proportional to the percentage of cells expressing the CXCR3 gene. j, Representative immunofluorescence staining of 6- to 7-month-old 5×FAD and WT mouse brains co-labeled with anti-CXCL10 (red), anti-GFAP (green) and DAPI (nuclei). Scale bar, 100 μm and 35 μm in inserts. k,l, The percentage of CXCL10 in 6- to 7-month-old 5×FAD and WT brains (n = 13, 5×FAD and n = 8, WT mice): hippocampus (k) and cortex (l). P values are from a nonparametric, two-sided Mann–Whitney U-test. In c, f, g, k and l, the boxplots show center lines as the medians, the box limits indicate the 25th and 75th percentiles and the whiskers extend 1.5× the IQR from the 25th and 75th percentiles; outliers are represented as dots.