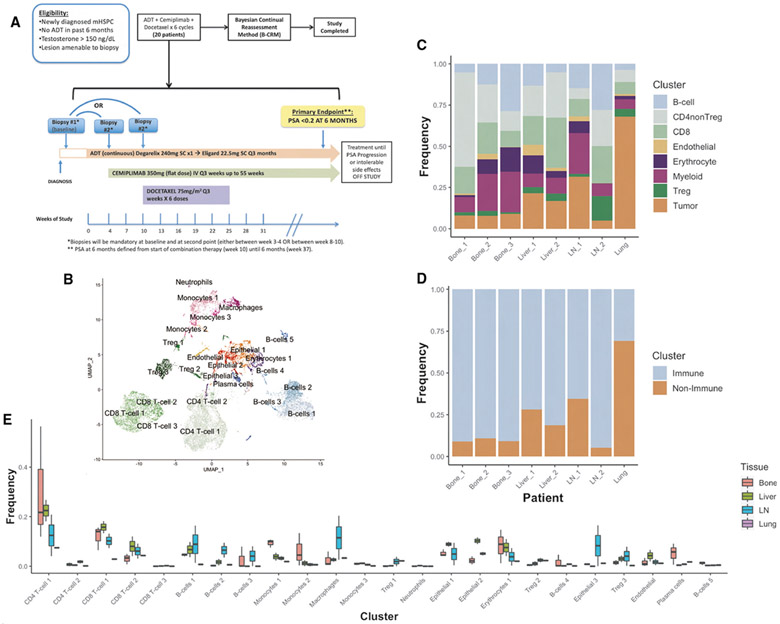
Figure 1. Baseline Composition of Micro-Environment by Tissue Site.
(A) Phase 2 trial design schema.
(B) Uniform manifold projection (UMAP) plot constructed from VIPER-inferred protein activity of all cells in aggregate across baseline pre-treatment patient samples. Cells are clustered by resolution-optimized Louvain algorithm with cell type inferred by SingleR.
(C) Stacked barplot of the frequency of each major cell lineage within each baseline patient sample, with each column representing a unique patient and patients grouped by metastatic site. Cell clusters from B are aggregated by shared cell type.
(D) Stacked barplot of immune vs. non-immune cell frequencies, from C.
(E) Boxplot showing distribution of frequencies for each cell cluster in B at baseline, comparing tissue sites. Also see Figure S1.

