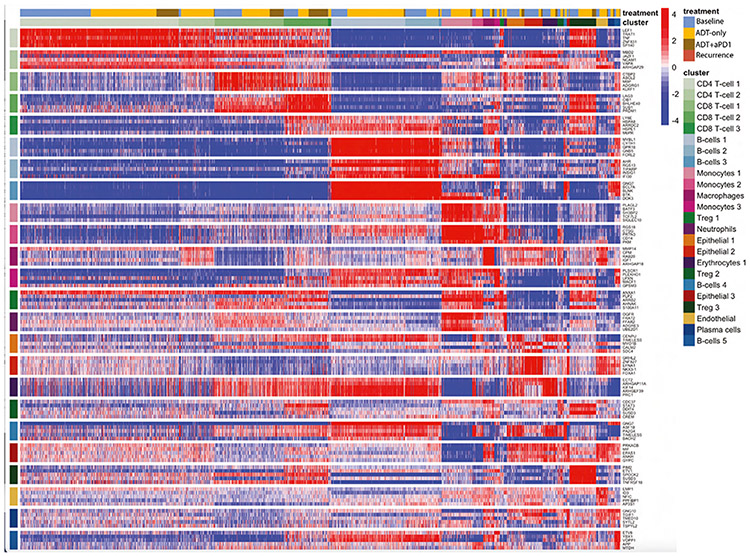
Figure 2. Top Protein Activity Cell Cluster Markers.
Heatmap of top 5 most differentially activated proteins for each cell type cluster from aggregate scRNA-seq data across all patient samples. Each row represents a protein, grouped by cluster in which they are the most active, with cluster labels on the x and y axes. Each column represents a single cell. Above the x axis cluster label there is also a treatment label indicating time point at which a given cell was profiled. Also see Figure S2.

