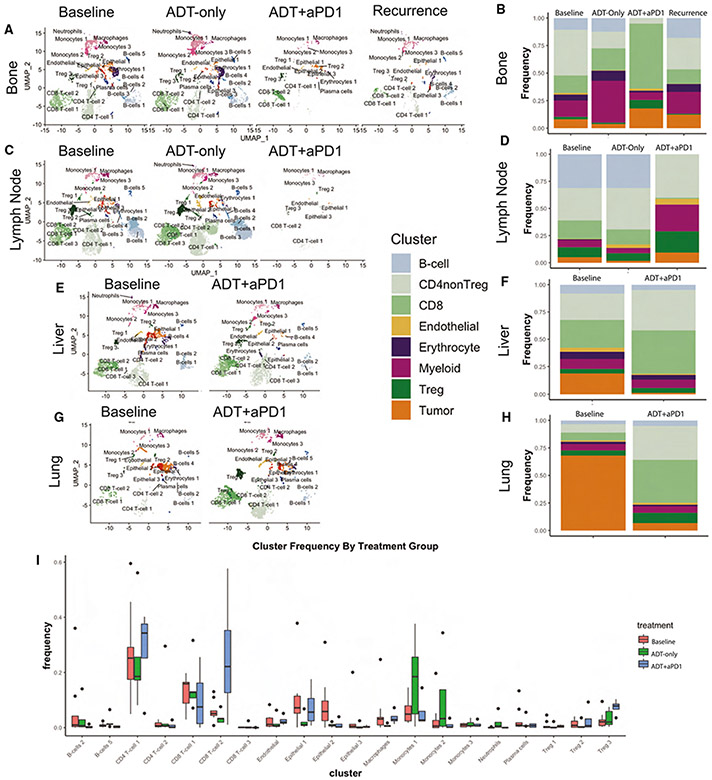
Figure 3. Treatment with ADT+anti-PD-1 Induces Dramatic Changes in the Tumor Micro-Environment.
(A) UMAP plot of all cells from patients with metastatic bone lesions, split by treatment time point (Baseline, ADT-only, ADT+anti-PD-1, and post-treatment recurrence) and labeled by cell cluster.
(B) Stacked barplot showing the relative frequency of each major cell lineage by treatment time point for patients with metastatic Bone lesions, with each column representing aggregate of all samples profiled at a specific treatment time point.
(C) UMAP plot, as in A, for patients with metastatic lymph node lesions.
(D) Stacked barplot, as in B, for patients with metastatic lymph node lesions.
(E) UMAP plot, as in A, for patients with metastatic liver lesions.
(F) Stacked barplot, as in B, for patients with metastatic liver lesions.
(G) UMAP plot, as in A, for patients with metastatic lung lesions.
(H) Stacked barplot, as in B, for patients with metastatic lung lesions.
(I) Boxplot showing distribution of frequencies for each cell cluster, comparing frequencies across treatment time points including baseline, ADT-only, and ADT+anti-PD-1. Also see Figure S4.

