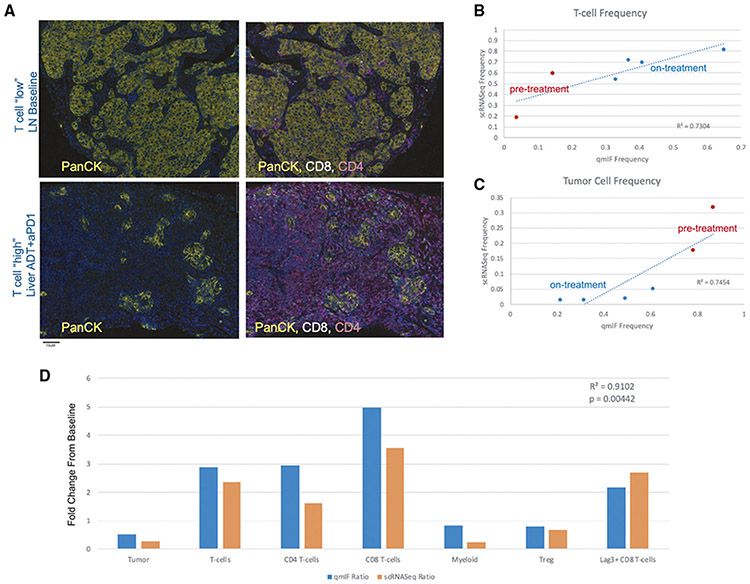
Figure 4. Immune Infiltration at Baseline and in Response to Treatment is Recapitulated by Immunofluorescence Analysis.
(A) Representative immunofluorescence staining images of samples with low T cell infiltration (top – a baseline lymph node slide section) and high T cell infiltration (bottom – an on-treatment liver slide section). Images on the left show PanCK tumor cell staining and images on the right additionally overlay CD4+ and CD8+ staining intensity.
(B) Comparison of cumulative T cell frequencies in paired specimens as determined by scRNA-seq (y axis) versus quantitative immunofluorescence (x axis), where pre-treatment samples are colored in red at lower T cell frequency and on-treatment samples are colored in blue at higher frequency. Linear regression line is plotted, with correlation value as shown and p value = 0.031.
(C) Comparison of cumulative tumor cell frequencies in paired specimens as determined by scRNA-seq (y axis) versus quantitative immunofluorescence (x axis), where pre-treatment samples are colored in red at higher frequency and on-treatment samples are colored in blue. Linear regression line is plotted, with correlation value as shown and p value = 0.026.
(D) Comparison of treatment-induced fold-change for a representative patient where baseline and on-treatment tissue was profiled by both scRNA-seq and quantitative immunofluorescence. Fold-change in each major cell population profiled by quantitative immunofluorescence is shown in blue, and fold-change by scRNA-seq is shown in orange. Fold-changes are broadly concordant across all cell populations between the two modalities, with statistically significant correlation across cell types (p value = 0.00442).

