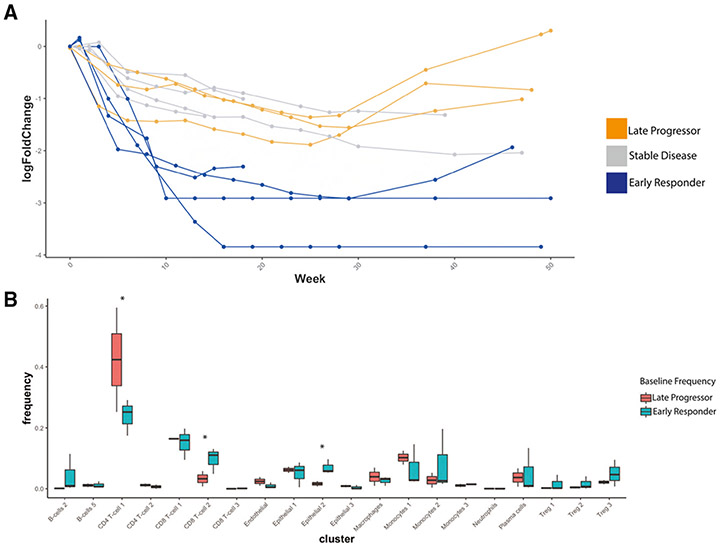
Figure 5. Differences in Baseline Immune Composition Associate with Differences in Treatment Response.
(A) Spider-plot of log10(Fold-Change) from baseline in prostate-specific antigen (PSA) over time with treatment, for each patient, such that four patients, labeled in blue, exhibited rapid and dramatic decrease to below 1% of initial PSA and were identified as early responders to treatment, and two patients, labeled in orange, initially responded to treatment with a rapid increase in PSA observed after on-treatment week 28. These were considered late progressors on-treatment. The remaining patients, in gray, generally trended toward a decreasing PSA, though not as rapidly as the early responders.
(B) Boxplot showing distribution of frequencies at Baseline for each cell cluster, comparing frequencies in early responders vs. late progressors, such that clusters with significant difference at baseline (p < 0.05 by Student’s t test) included CD4+ T cell 1, CD8+ T cell 2, Treg 3, and Epithelial 2.

