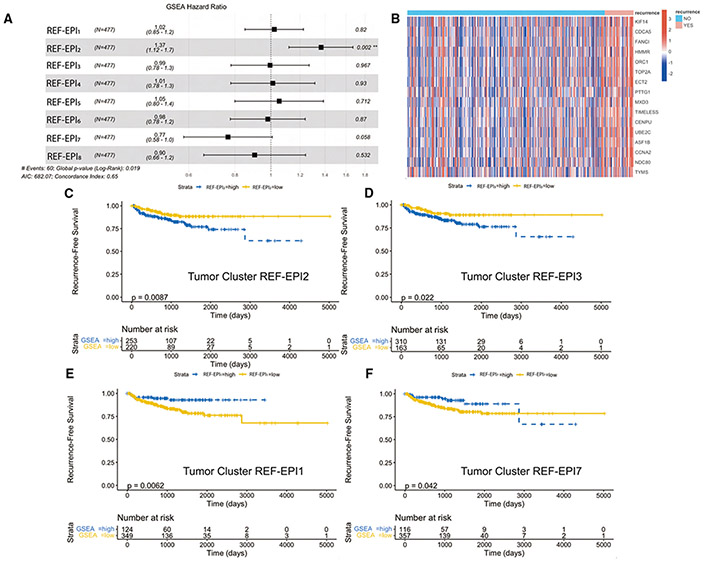
Figure 7. Tumor Single-Cell Subcluster Signatures Associate with Differential Outcomes in TCGA.
(A) Forest plot of Cox regression hazard ratios testing association in TCGA of patient-by-patient normalized enrichment score for each tumor subcluster gene set with recurrence-free survival. REF-EPI2 gene set enrichment is significantly associated with worse survival outcomes (p = 0.002).
(B) Heatmap of leading-edge gene set from REF-EPI2 comparing all recurrent vs. non-recurrent patients in TCGA.
(C) Kaplan-Meier curve testing association of binarized REF-EPI2 gene set enrichment (greater than 0 = high, less than 0 = low) with recurrence-free survival in TCGA, such that REF-EPI2 enrichment significantly associates with worse recurrence-free survival.
(D) Kaplan-Meier curve testing association of binarized REF-EPI3 gene set enrichment (greater than 0 = high, less than 0 = low) with recurrence-free survival in TCGA, such that REF-EPI3 enrichment significantly associates with worse recurrence-free survival.
(E) Kaplan-Meier curve testing association of binarized REF-EPI1 gene set enrichment (greater than 0 = high, less than 0 = low) with recurrence-free survival in TCGA, such that cluster 0 enrichment significantly associates with improved recurrence-free survival.
(F) Kaplan-Meier curve testing association of binarized REF-EPI7 gene set enrichment (greater than 0 = high, less than 0 = low) with recurrence-free survival in TCGA, such that REF-EPI7 enrichment significantly associates with improved recurrence-free survival, up to 2800 days. Kaplan-Meier curves are not shown for the remaining clusters as log rank p values for these were not statistically significant (p > 0.05). Also see Figures S6 and S7.

