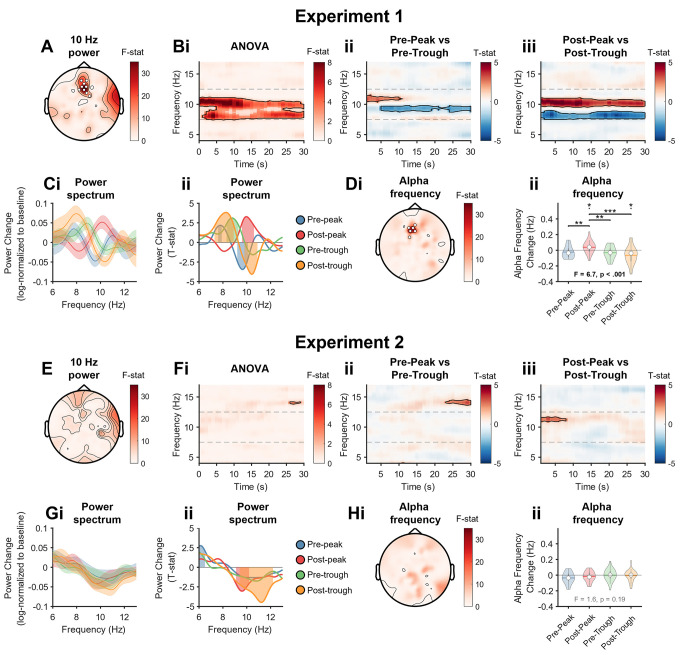
Fig 2. Stimulation-induced power and frequency changes.
(Ai) Topography of 10 Hz (9.8–10.2 Hz) power change ANOVA. We computed the power spectral density for every phase condition in the “on” and “off” periods and expressed stimulation-induced changes by log-transforming the ratio of “on” to “off” periods per frequency bin. White marks indicate cluster-corrected p < 0.05. (Aii) Time-frequency ANOVA. Outlined clusters p < 0.05. (Bi) Time-frequency, pre-peak vs. pre-trough, for the frontal ROI (see ROI specification in Materials and methods). Positive values indicate pre-peak > pre-trough. Outlined clusters ANOVA p < 0.05. (Bii) Time-frequency, pre-peak vs. pre-trough, at respective regions of interest. Positive values indicate post-peak > post-trough. Outlined clusters t test p < 0.05. (Ci) Power change spectrum (% change from “off” periods) across the alpha-band frequencies for the 4 targeted phases collapsed across the stimulation period in the frontal ROI. (Cii) Power change spectrum (T-values, one-sample T test) at respective region of interest. Shaded regions p < 0.05. (Di) Topography of frequency change ANOVA. White marks indicate cluster-corrected p < 0.05. (Dii) Frequency change violin plots, stats indicate linear mixed effects model results and contrasts, *** p < 0.001, ** p < 0.01, * p < 0.05, † p < 0.1, Wald tests. (E–H) Show the same analyses/results as A–D, but for experiment 2. ROI, region of interest.

