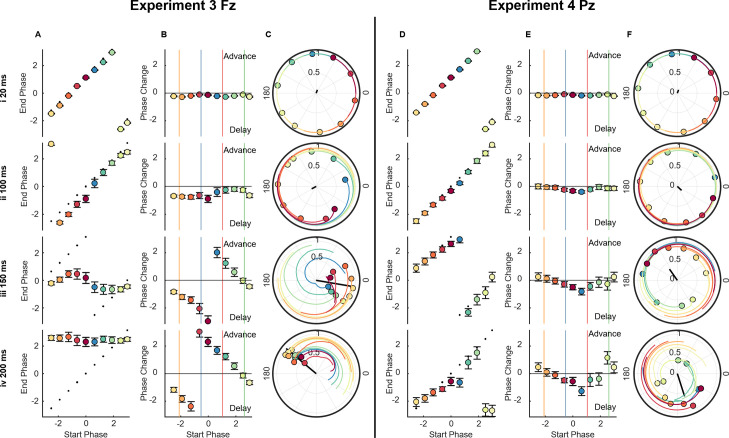
Fig 4. Phase transfer and phase response curves.
(A and D) PTC, showing start phase vs. end phase (in radians) for Fz in experiment 3 (A) and Pz in experiment 4 (D). Dashed line indicates predicted phases, based on a 10 Hz oscillation. Error bars indicate standard error of the mean, computed in a circular fashion. (B and E) PRC, showing start phase vs. phase change from predicted phase (in radians) for Fz in experiment 3 (B) and Pz in experiment 4 (E). Horizontal line indicates zero. Vertical coloured lines indicate where actual conditions fell in their stimulus onset phase. Error bars indicate standard error of the mean, computed in a circular fashion. (C and F) Group phase and resultant for each of the 10 starting phase bins. Black line indicates resultant of all phase bins. Coloured lines indicate trajectory of each phase bin, across the preceding 50 ms, for Fz in experiment 3 (C) and Pz in experiment 4 (F). All figures are shown for delays 20 ms, 100 ms, 150 ms, and 200 ms. Fz and Pz electrodes from the hd-EEG system. PRC, phase response curve; PTC, phase transfer curve.

