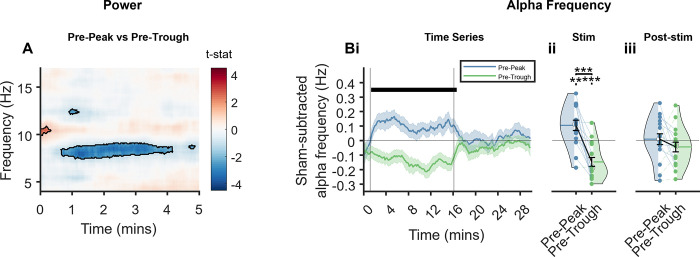
Fig 5. Effects of stimulation phase on power and frequency at Fz.
(A) Time-frequency representation of differences between stimulation conditions during the first 5 min of stimulation, as per paired t tests. Red colours indicate pre-peak>pre-trough and blue indicates pre-peak<pre-trough. Black lines outline statistically significant clusters. (B) Sham-subtracted alpha frequency (i) across time, error bars are SEM vertical lines represent stimulation start and stop; thick horizontal bar indicates time points at which p ≤ 0.5, as calculated by t test (ii) collapsed across the stimulation period; (iii) collapsed across the post-stimulation period. Fz electrode from the αCLAS EEG system as this electrode was not part of the PSG system. αCLAS, Alpha Closed-Loop Auditory Stimulation.

