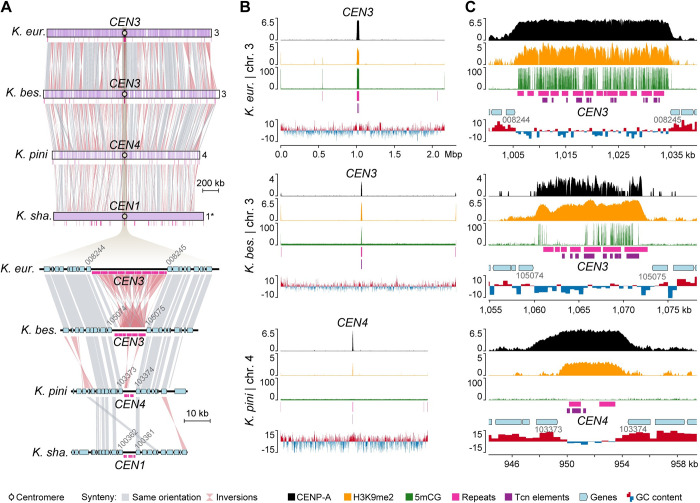
Fig 4. Experimental validation of Kwoniella centromeres in 3 species with different numbers of chromosomes.
(A) Gene synteny conservation spanning a predicted centromeric region in 4 Kwoniella species (CEN3 of K. europaea, CEN3 of K. bestiolae, CEN4 of K. pini, and CEN1 of K. shandongensis). (B) Plots of the chromosomes depicted in panel A (except for K. shandongensis) displaying CENP-A (black) and H3K9me2 (orange) enrichment, fraction of CG cytosine DNA methylation (5mCG, green), repeat content (pink), Tcn-like LTR elements (purple), and GC content (shown as deviation from the genome average—red, above; blue, below). The fold enrichment of each sample over the input DNA is shown on the left of each panel for CENP-A and H3K9me2. (C) Zoomed-in sections show the regions spanning the centromeres with adjacent genes (light blue). In panels B and C, data are computed in 5-kb nonoverlapping windows.

